🌍 Public
demographic school snapshot
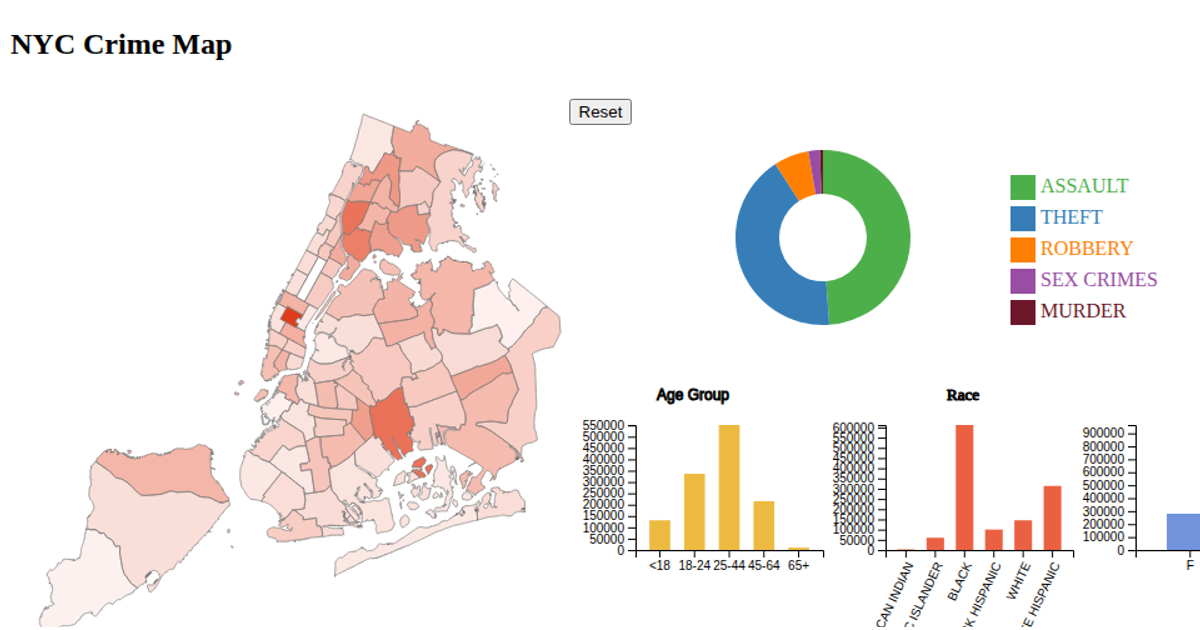
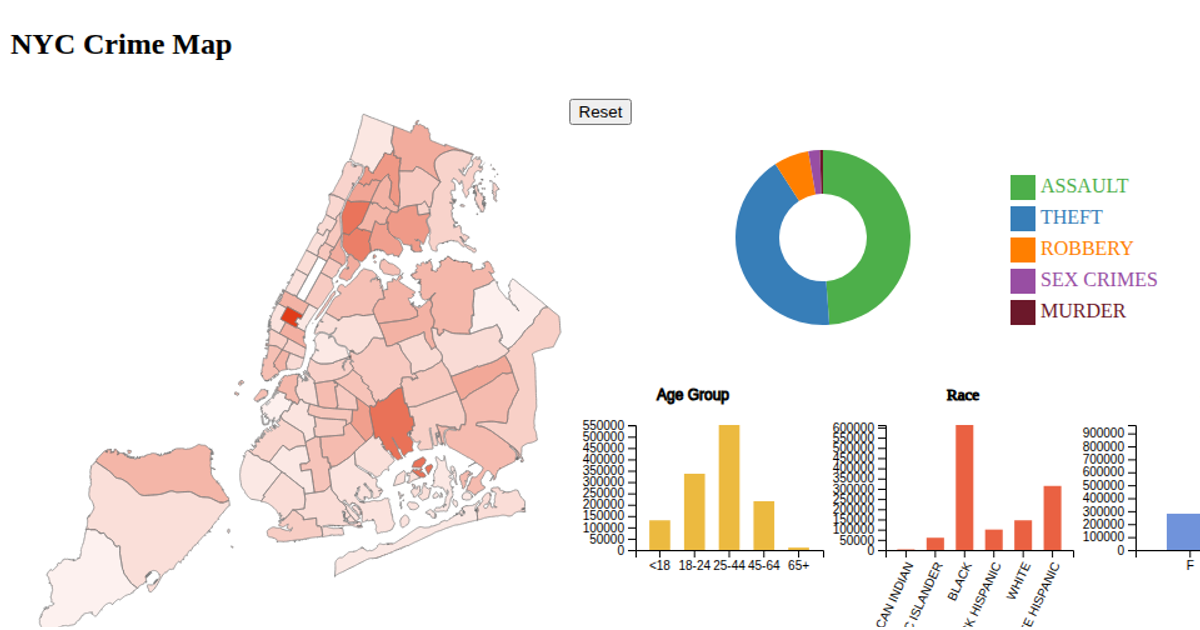
This interactive dashboard presents a demographic snapshot of NYC crime incidents, linking a choropleth precinct map to a pie chart of crime types and bar charts for victim age, race, and sex through coordinated brushing and a reset button. It uses d3.geoPath with a Mercator projection to render the map and d3.arc for the pie, while animated transitions update all charts based on user selections. The code relies on d3.v6, d3-array, and d3-geo, with SVG and tooltips for hover details.
AI-generated descriptionA bare minimum HTML page demonstrating use of CSS and JavaScript.
See also React Starter.
MIT Licensed





Comments
Sign in to join the discussion.