🌍 Public
Forkcriv
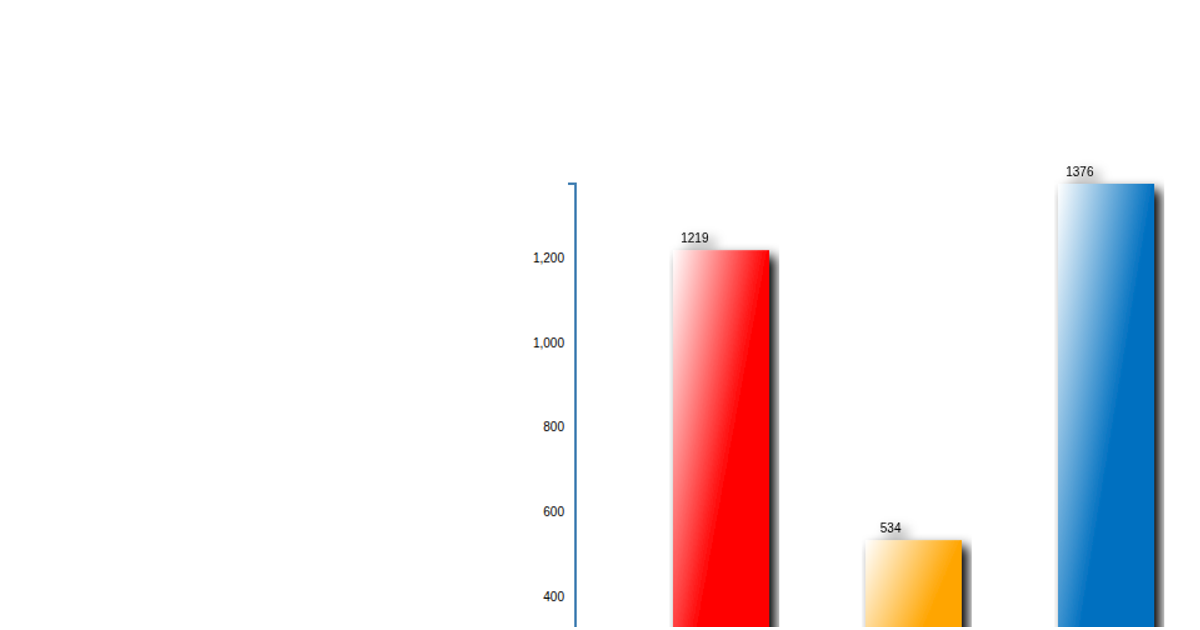
This example shows interactive bar charts and a pie chart rendered as SVG, where the bar widths animate over one second to reflect the highest score in each dataset. It integrates D3.js with AngularJS, using an Angular directive (`d3Bars`) to create the bars and a second directive (`d3Pie`) to generate the pie chart with `d3.svg.arc` and `d3.layout.pie`. A custom `d3Service` loads D3 asynchronously, and chart updates occur via `scope.$watch` on the data array. Bar text labels display each item’s name and score.
AI-generated descriptionMIT Licensed





Comments
Sign in to join the discussion.