🌍 Public
Getting started Chartjs
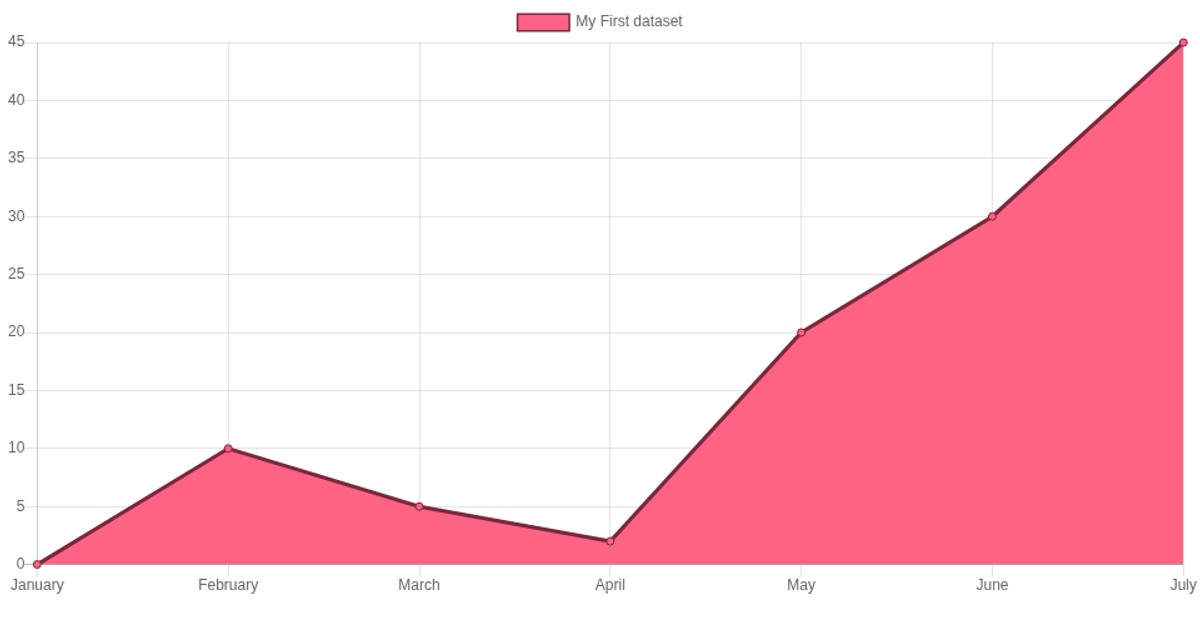
This example displays a simple line chart with six labeled data points and their corresponding values. It demonstrates a minimal setup using the Chart.js library, loaded from a CDN, to render the visualization onto an HTML5 Canvas element. The code initializes a Chart instance via its constructor, passing a configuration object that specifies the line chart type, the dataset labels and numeric values, and options such as enabling the y-axis to start at zero. The page also includes local CSS styling and demonstrates importing libraries via a script tag.
AI-generated descriptionAn example showing the capabilities of VizHub:
- Loads D3 via UNPKG.
- Demonstrates use of
importfrom"d3". - Demonstrates use of
importfrom local ES6 modules.
MIT Licensed


Comments
Sign in to join the discussion.