🌍 Public
Activity 7.1_Question2
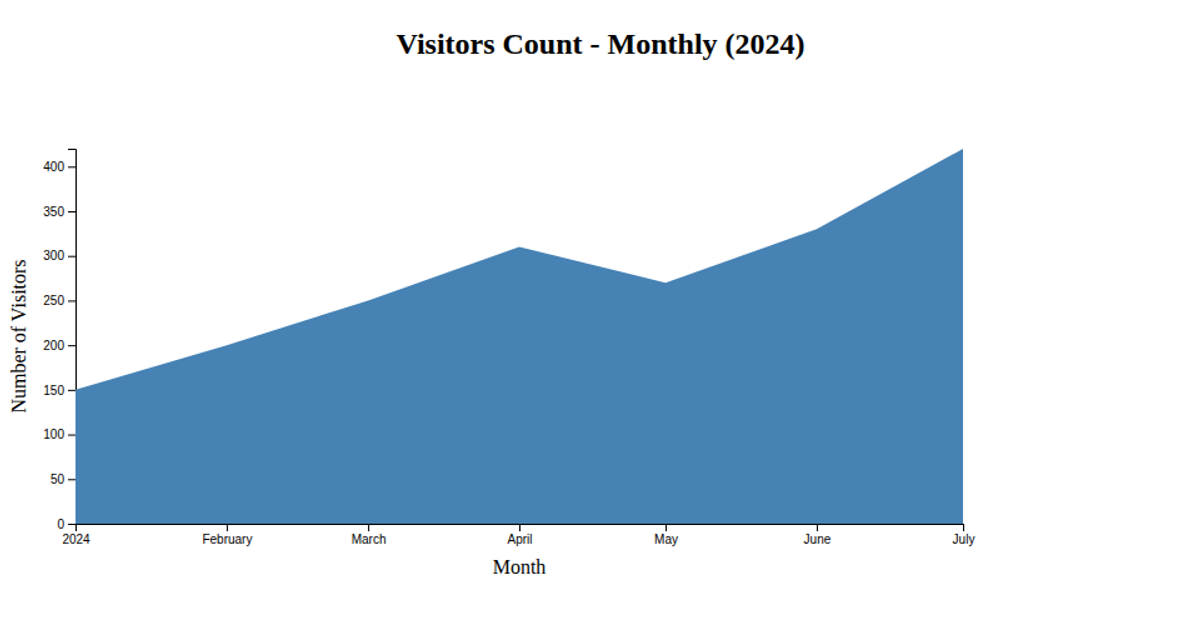
This area chart visualizes the monthly airline passenger counts for 1958 from the classic AirPassengers time series dataset. It combines a blue gradient area fill with a solid line and circular data points, all rendered as SVG using D3 v7. The chart includes interactive tooltips on mouse hover and highlights the peak passenger month. It uses `d3.csv`, `d3.scaleTime`, `d3.scaleLinear`, `d3.area`, `d3.line`, and `d3.axisBottom` to load, scale, generate, and render the visualization.
AI-generated descriptionMIT Licensed




Comments
Sign in to join the discussion.