🌍 Public
Bar Graph
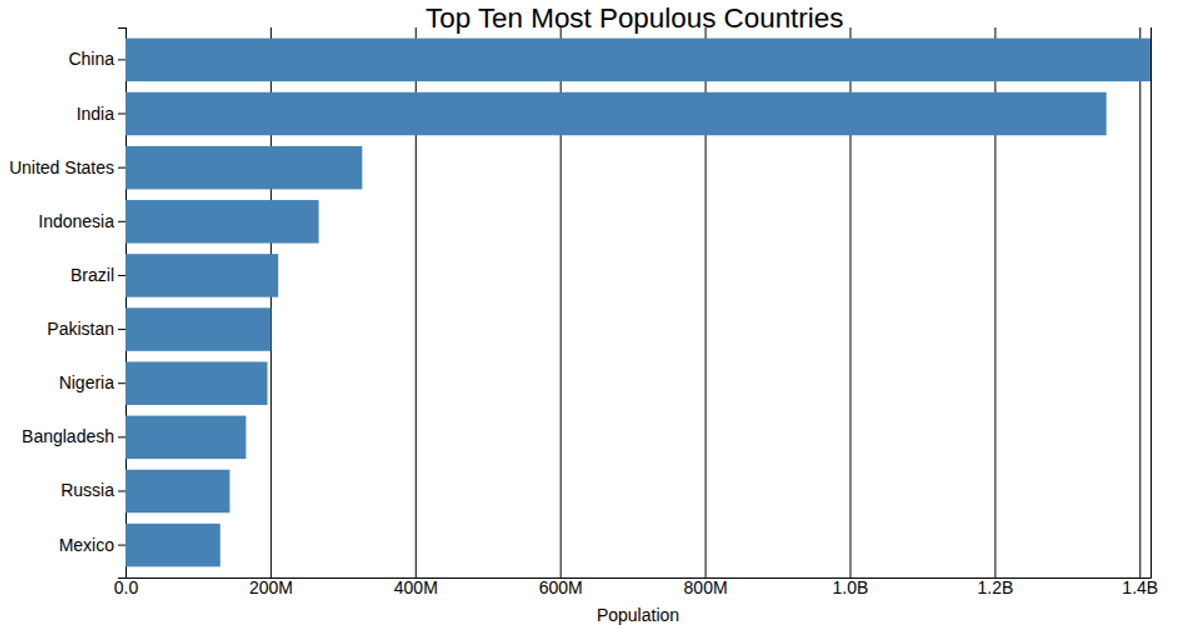
This bar graph displays the population sizes of the top 100 countries, using a vertical bar for each nation ordered along the x-axis. The chart uses `d3.scaleBand` for the categorical country axis and `d3.scaleLinear` for the population scale, rendering rects with a `title` tooltip. Data comes from the CSV file `Population.csv`, and the axes are drawn with `d3.axisBottom` and `d3.axisLeft`.
AI-generated descriptionMIT Licensed


Comments
Sign in to join the discussion.