🌍 Public
Fork of Fork of FZ_ICE8_Q2_FamilyTree
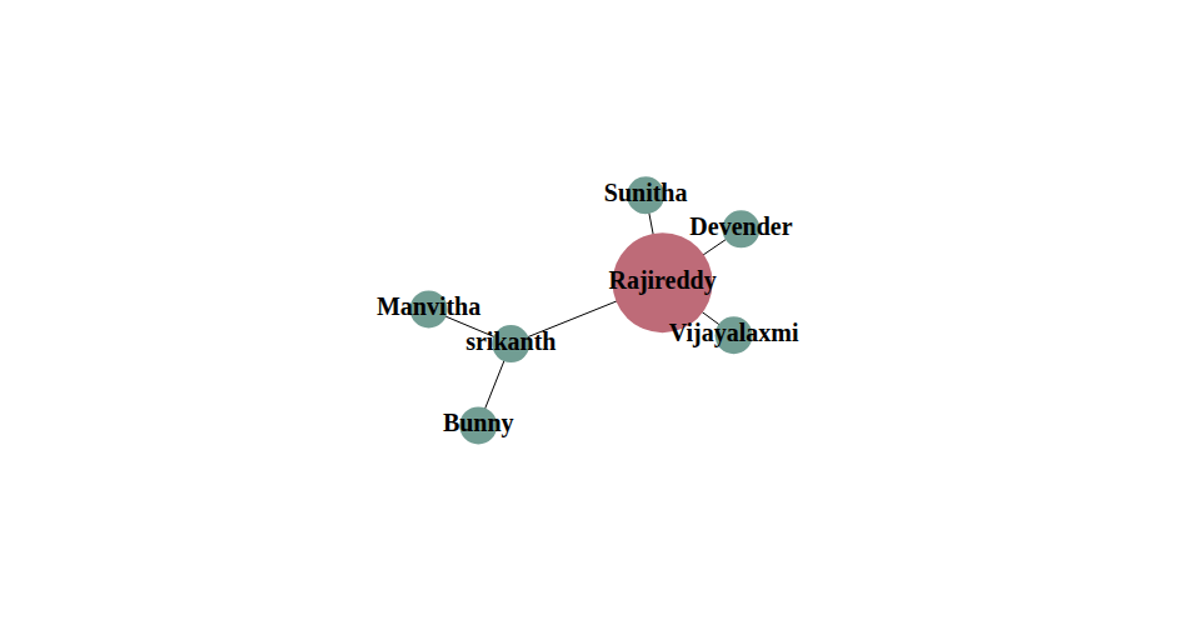
This interactive network diagram visualizes the dependencies within a software architecture, organizing components into colored groups like UI, Server, and Storage. A physics-based simulation, driven by D3.js and the `d3.forceSimulation` API, positions the labeled nodes, with `d3.forceLink`, `d3.forceManyBody`, and `d3.forceCollide` managing link distances, repulsion, and overlap prevention. The SVG rendering updates node positions on each simulation tick, and the implementation includes drag functionality for user interaction. The underlying graph is defined by hardcoded JavaScript arrays of node and link objects.
AI-generated descriptionMIT Licensed


Comments
Sign in to join the discussion.