🌍 Public
Arc Diagram try
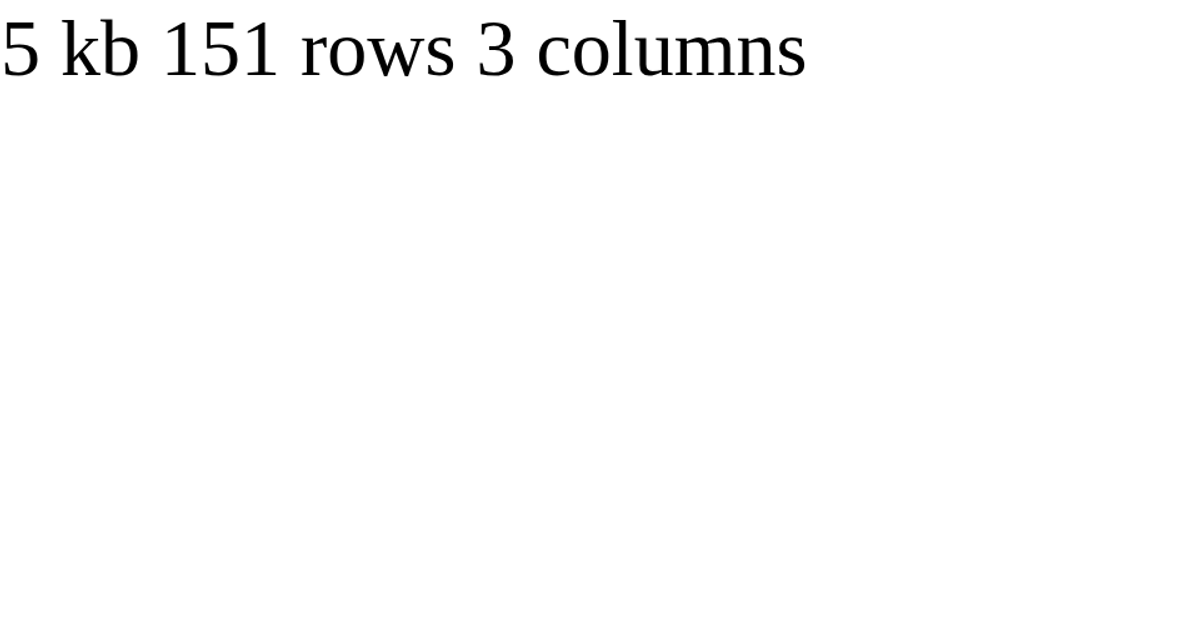
This arc diagram example loads a CSV file of experimental data from a GitHub Gist, which is parsed using D3’s `d3.csv` method to report the dataset’s size, row count, and column count. The visualization displays this summary information as large, styled text on a blank page, with an alternative commented-out approach using `fetch` and `async`/`await` for comparison. The example demonstrates basic CSV parsing and asynchronous data loading concepts within a React framework, using D3 v5.
AI-generated descriptionA program that loads and parses some CSV data: CSS Named Colors.
See also:
MIT Licensed







Comments
Sign in to join the discussion.