🌍 Public
Let's make cheap tricks with D3.js!
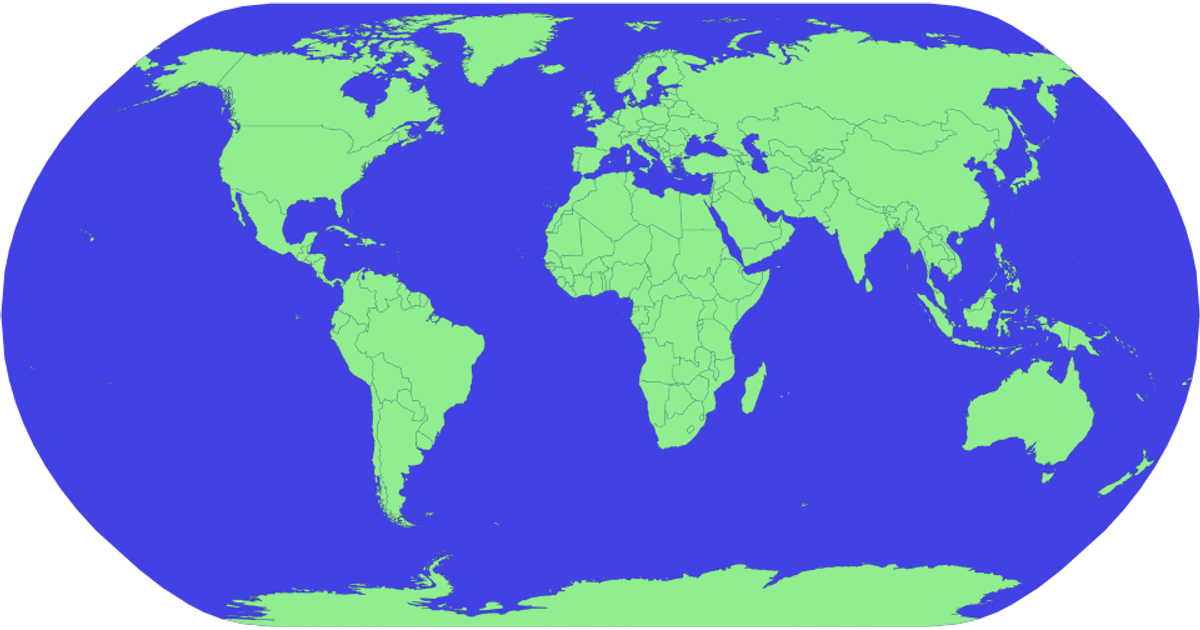
This example displays a zoomable, equal-earth projection of the world with countries rendered as colored SVG paths and names revealed on hover. It uses D3.js v5 with the `d3.geoPath` and `d3.geoEqualEarth` projections, plus the `d3.zoom` module for interactive pan and zoom. Country boundaries come from the world-atlas TopoJSON dataset, while names are joined from a TSV file, and a hover effect changes country fill to red.
AI-generated descriptionMIT Licensed



Comments
Sign in to join the discussion.