🌍 Public
Stacked bar chart
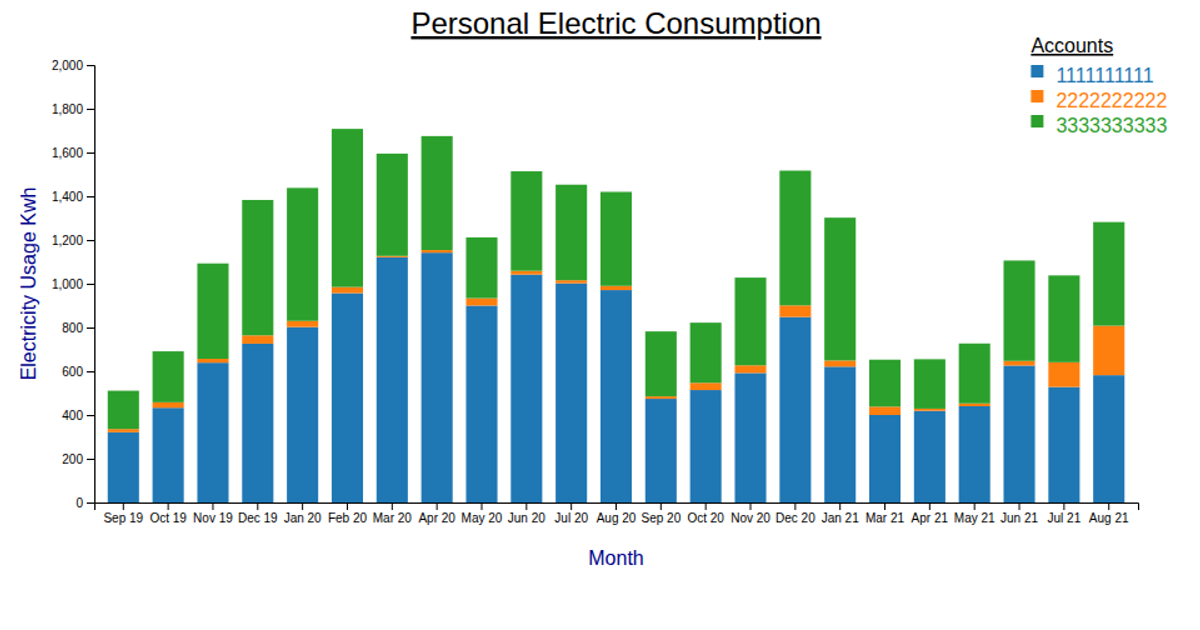
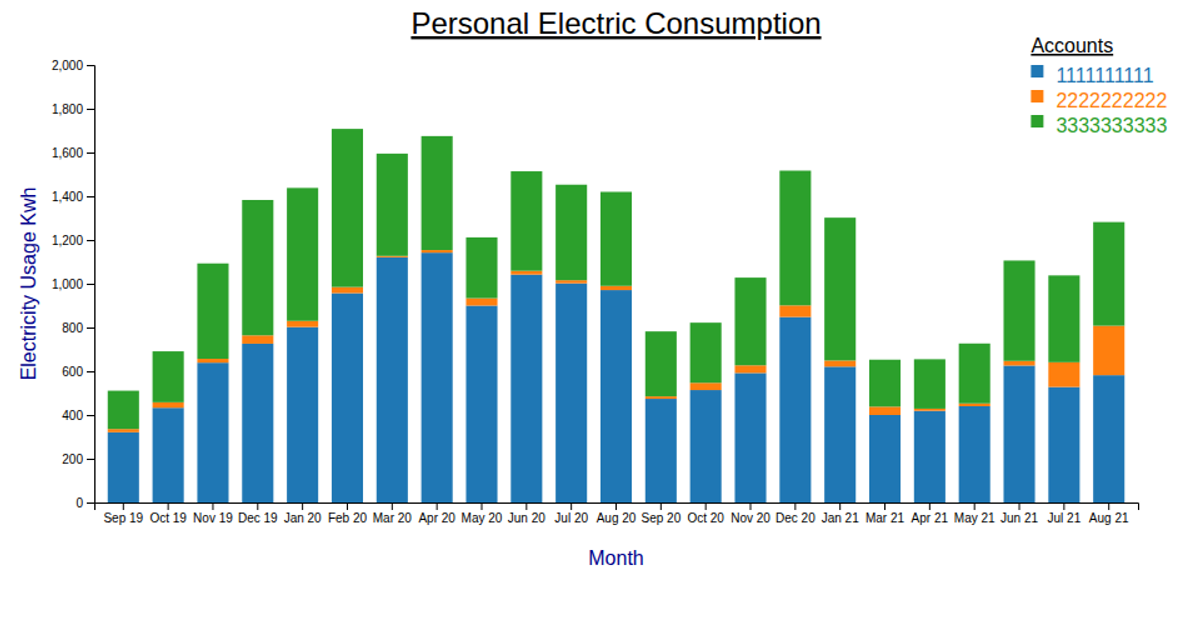
This stacked bar chart displays monthly electricity consumption in kilowatt-hours, segmented by account number. It uses D3.js with the `d3-scale-chromatic` library for color mapping, rendering via SVG and canvas. Data is grouped by read date and stacked using `d3.stack()`, with axes scaled by `scaleBand` and `scaleLinear`. Mouseover interactions adjust bar opacity, and a title tooltip shows the segment’s kilowatt-hour value.
AI-generated descriptionMIT Licensed




Comments
Sign in to join the discussion.