🌍 Public
Fork of Missing Migrants Scatter Plot
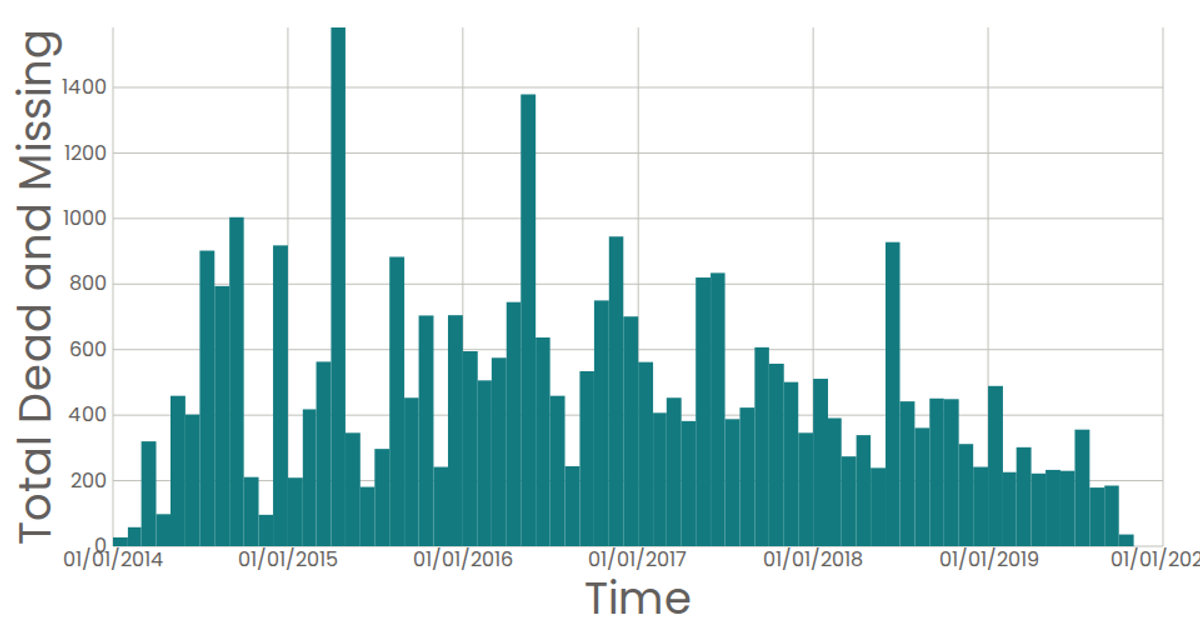
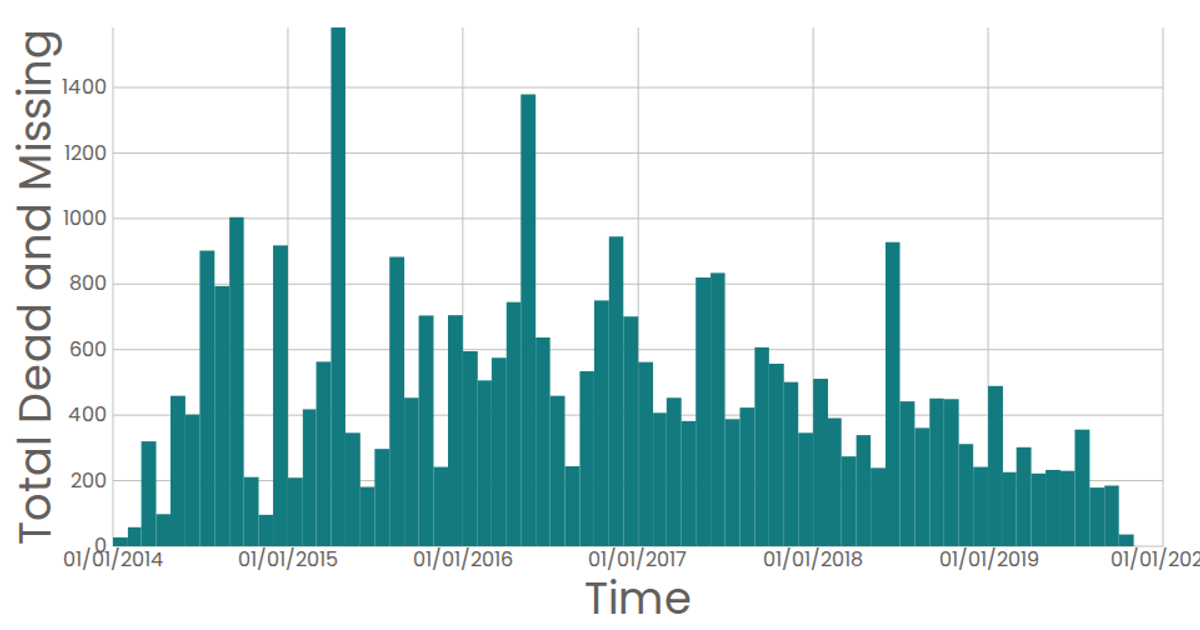
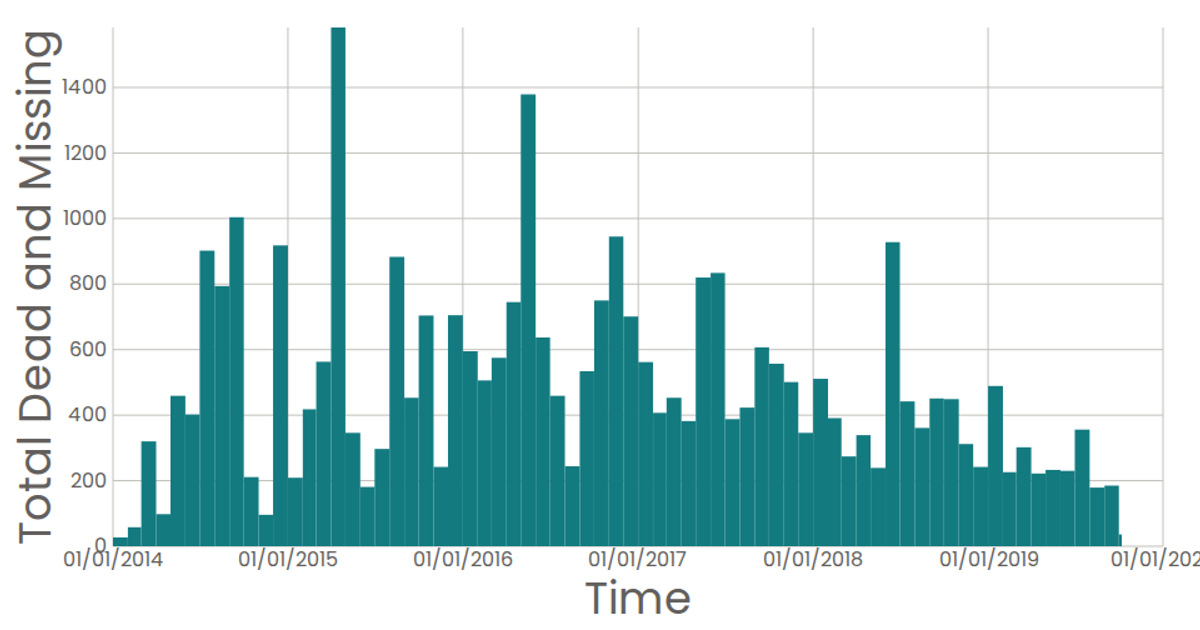
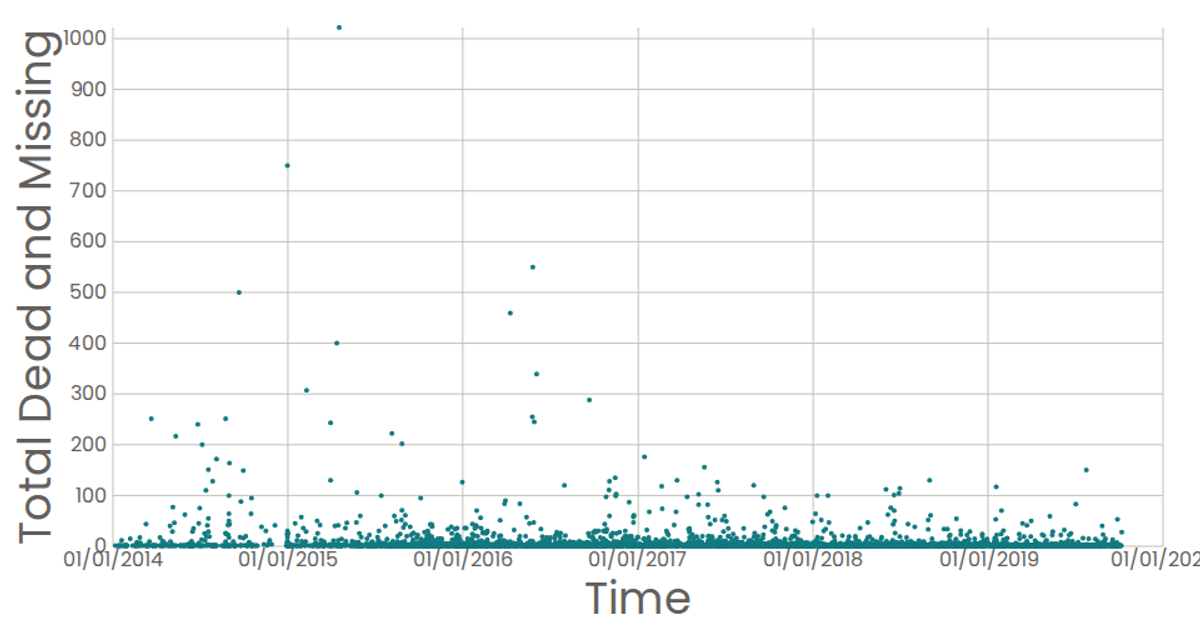
This fork of the Missing Migrants scatter plot visualizes the total number of dead and missing migrants over time. It bins the data by month and renders a histogram where each bar represents the sum of casualties for that period. The visualization is built with React and D3 v5, using SVG for rendering. It loads data from a CSV file via the `csv` API, employs `scaleTime` and `scaleLinear` for the axes, and uses the `histogram` function for binning.
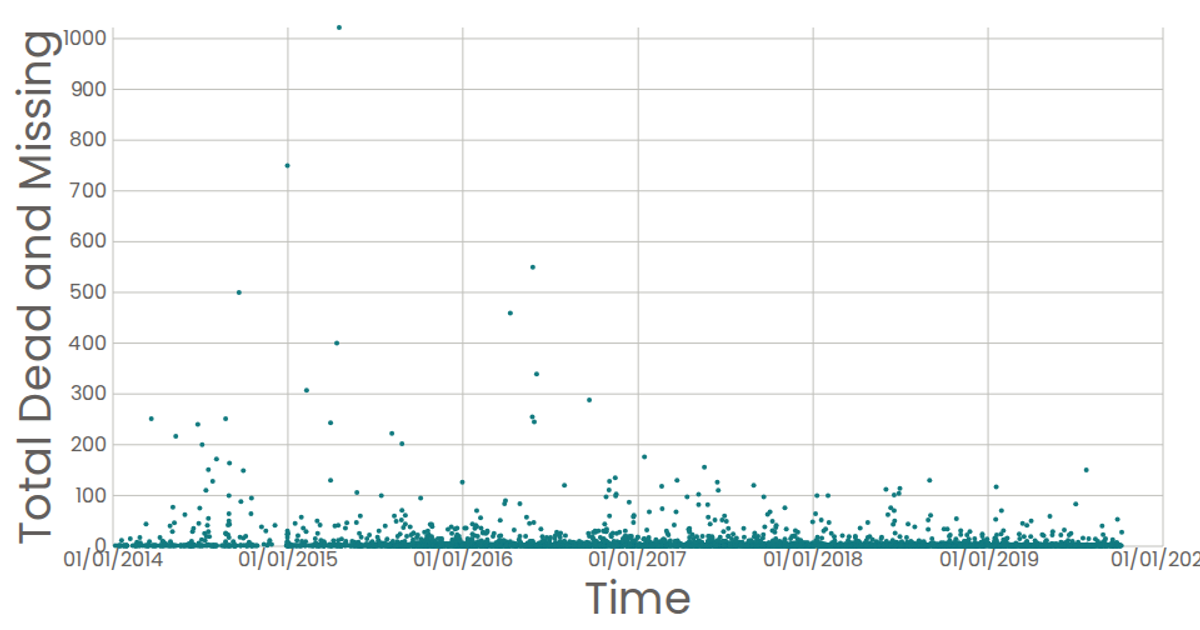
AI-generated descriptionA scatter plot of the Missing Migrants Dataset.
Each point in the plot represents a single event.
MIT Licensed



Comments
Sign in to join the discussion.