🌍 Public
A9-World Choropleth Map
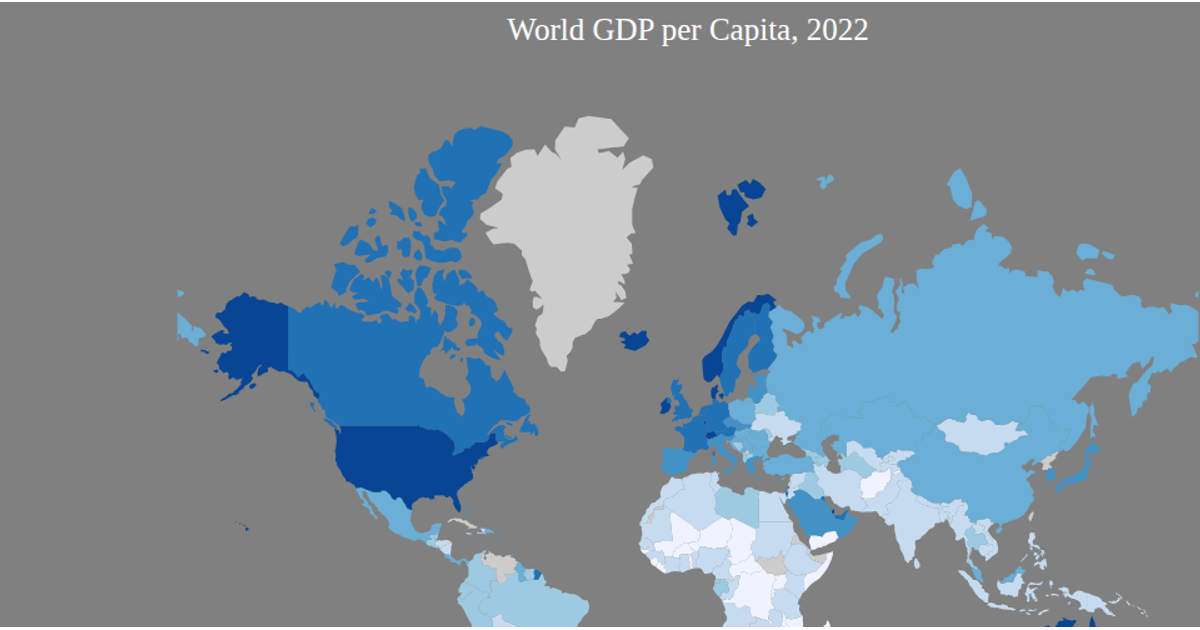
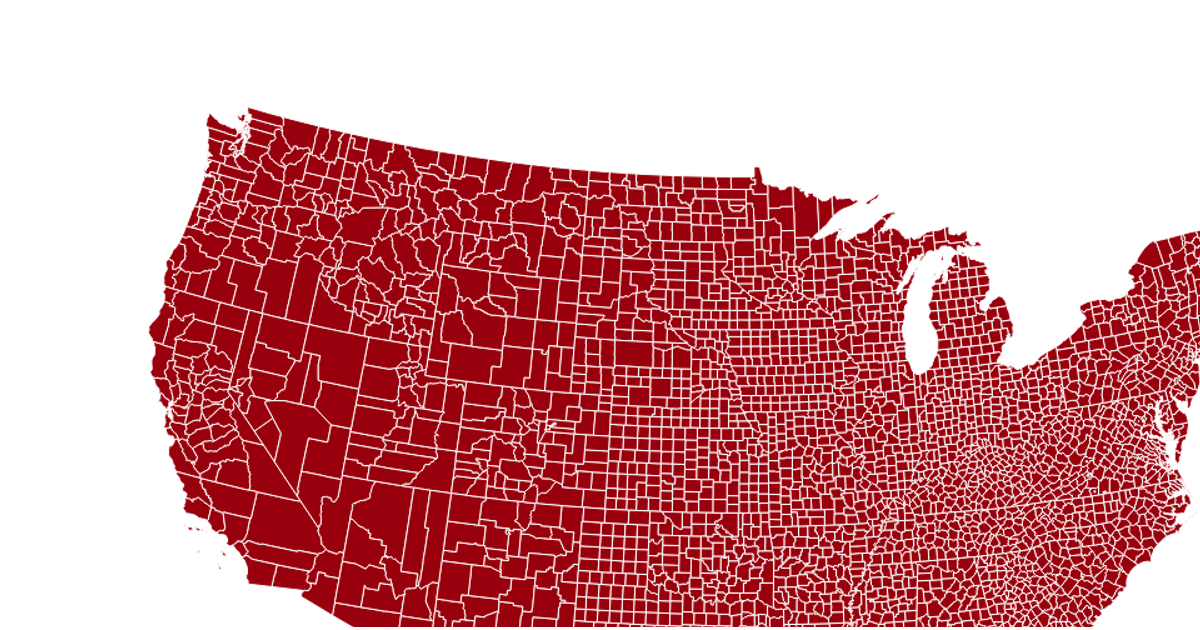
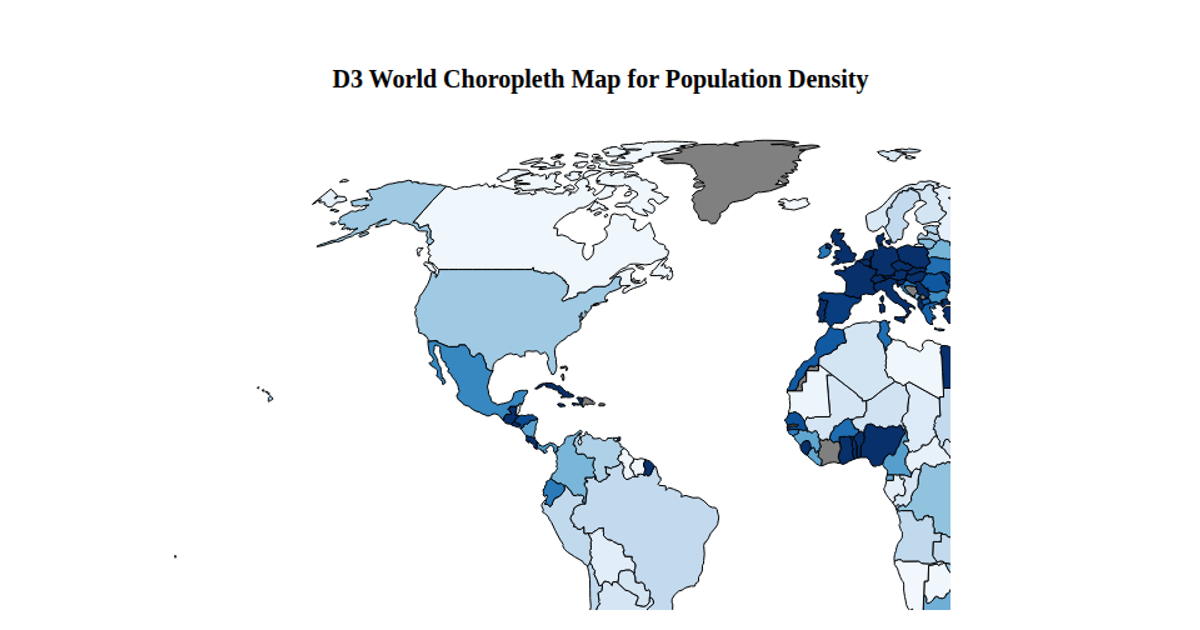
This is a choropleth map showing the global crime index by country, using a red sequential color scale where darker shades indicate higher crime levels. The visualization loads world GeoJSON boundaries and crime index data from a CSV, then renders each country as an SVG path via `d3.geoPath` with a Mercator projection. A tooltip displays the country name and crime index on hover, while the color scale is defined with `d3.scaleSequential` and `d3.interpolateReds`. Countries without data appear gray.
AI-generated descriptionMIT Licensed




Comments
Sign in to join the discussion.