🌍 Public
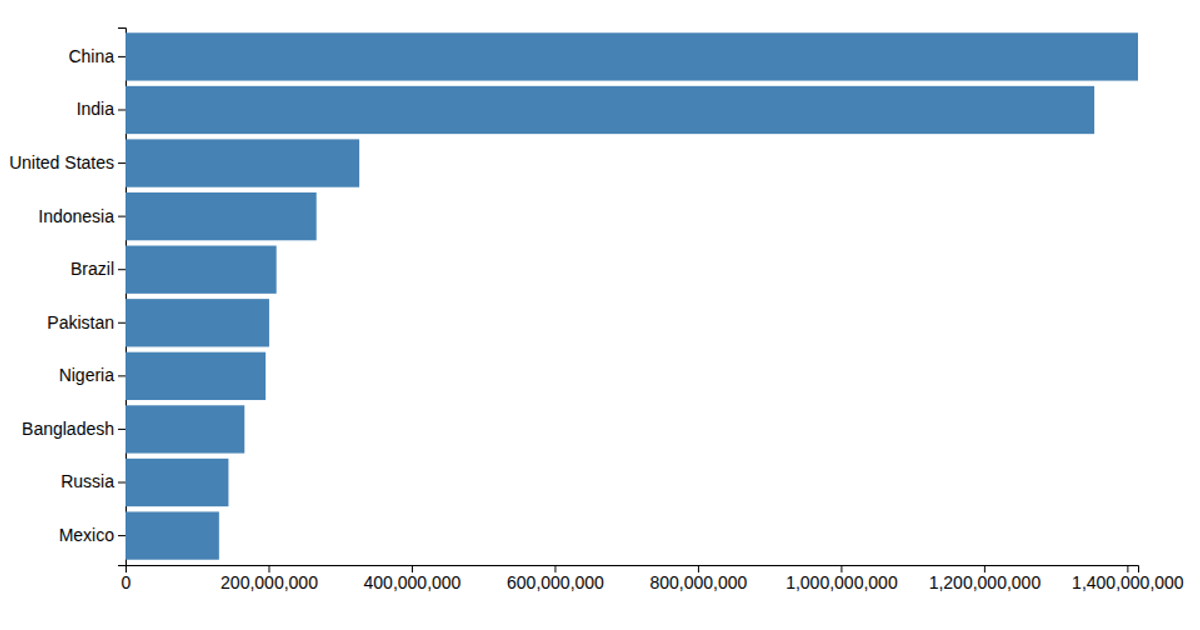
Let's make a bar chart
A bar chart displays population values for East African nations from a CSV file, with repeated entries producing overlapping rectangles. Each data point becomes a square via D3's `selectAll`, `data`, and `enter` methods, set to fixed 300-pixel dimensions. The code loads the data using `d3.csv`, multiplies population values by 100, and renders SVG rectangles without axis or scaling logic.
AI-generated descriptionMIT Licensed




Comments
Sign in to join the discussion.