Edmonton2019FederalPollingRiverbend
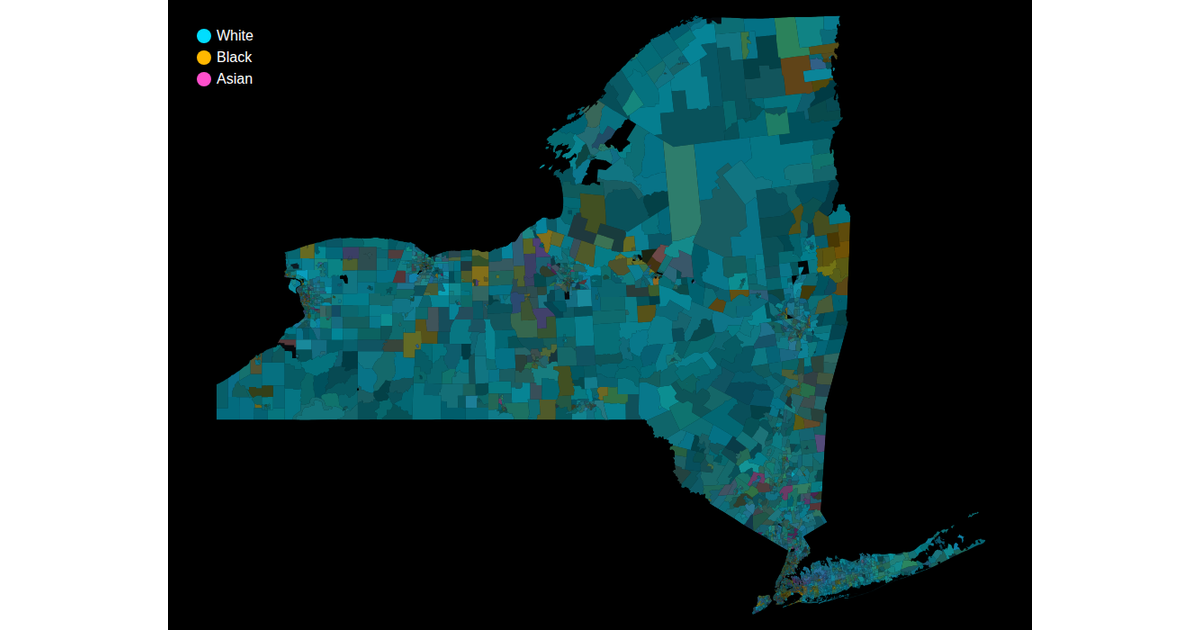
This visualization displays the racial demographics of Edmonton’s federal polling district Riverbend using census tract boundaries. Each polygon’s fill blends three HCL color-space scales—one each for White, Black, and Asian populations—using a square root scale for value encoding. The map is rendered with D3 v6’s `geoPath` and topojson, with hover strokes highlighting tract boundaries. Data is sourced from the 2018 ACS API, and a legend labels the three color categories.
AI-generated descriptionA way to visualize multidimensional racial demographic data for census tracts. This uses a square root scale instead of a linear scale, and uses 3 colors that are all the same saturation and luminance (in the HCL color space).
Data from bl.ocks.org: New York Census Tracts by Mike Bostock.
Fetching of American Community Survey data inspired by Observable: Racial distribution in NC by Mark McClure.
The variables used are documented in the ACS API Reference.
Color legend from VizHub: Color and Size Legends.



Comments
Sign in to join the discussion.