🌍 Public
Naturalized Bar Chart
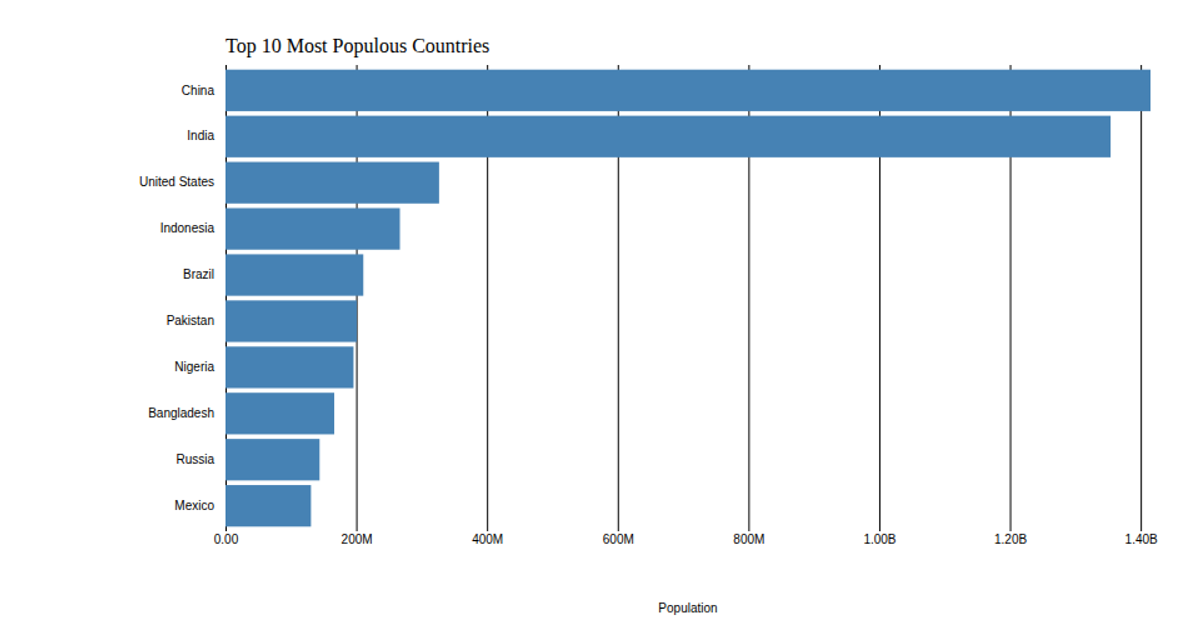
This example visualizes the number of persons naturalized by country of nationality for fiscal year 2019, using a horizontal bar chart where bar lengths correspond to quarterly naturalization counts. The visualization is built with SVG rendering and employs D3 v5’s `scaleLinear`, `scaleBand`, `axisLeft`, and `axisBottom` APIs to map data values to positions and axes, with data loaded from a remote CSV file. The chart customizes tick labels via a `format` function that converts large numbers to abbreviated forms, and removes default axis lines for a cleaner presentation.
AI-generated descriptionMIT Licensed



Comments
Sign in to join the discussion.