🌍 Public
Sol Lewitt with D3
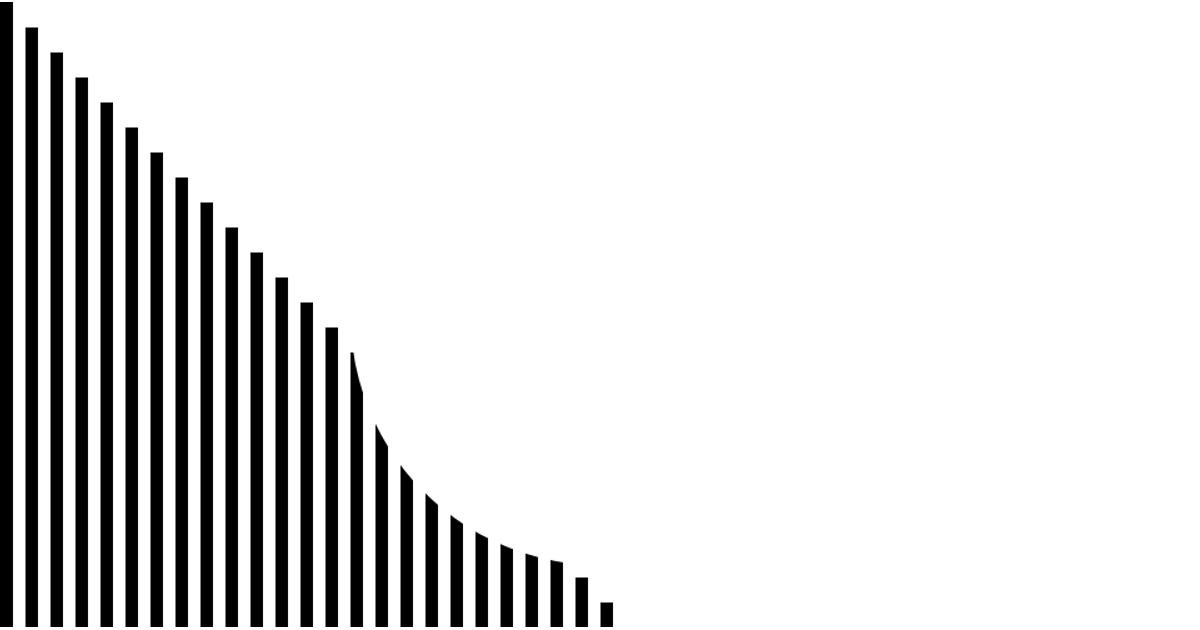
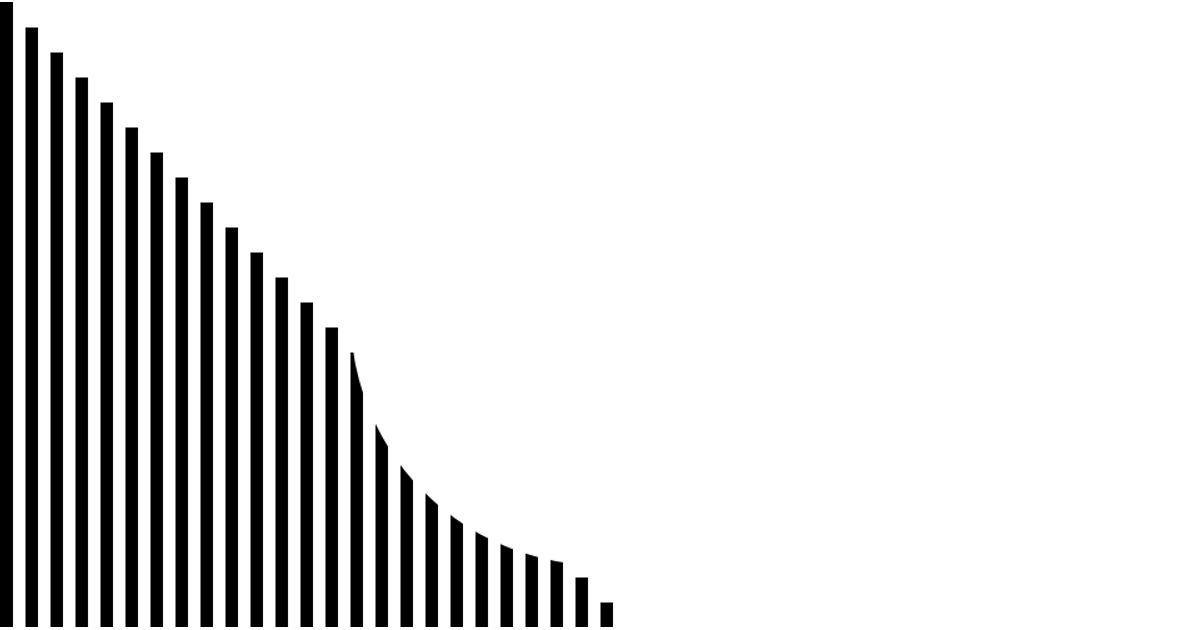
This example recreates a Sol LeWitt-inspired drawing by layering horizontal and vertical stripes within circular masks. The stripes are generated as SVG rectangles using D3's `select` and `range` utilities, with the `join` operator binding data to the DOM. Two SVG masks create contrasting circular windows: one reveals the grid inside a circle, the other creates an inverse ring effect. The visualization adapts to the full browser window, using the viewport dimensions for the canvas size, and renders entirely through SVG elements without a separate data source.
AI-generated descriptionreplica of sol lewitt with svg.
MIT Licensed



Comments
Sign in to join the discussion.