🌍 Public
task9b
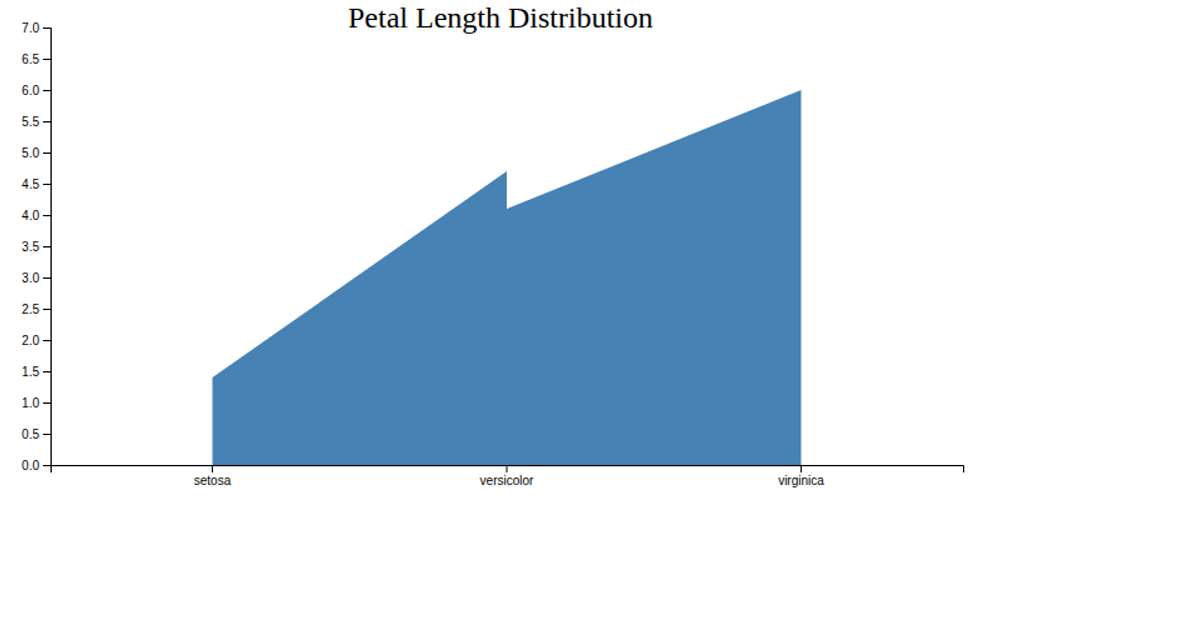
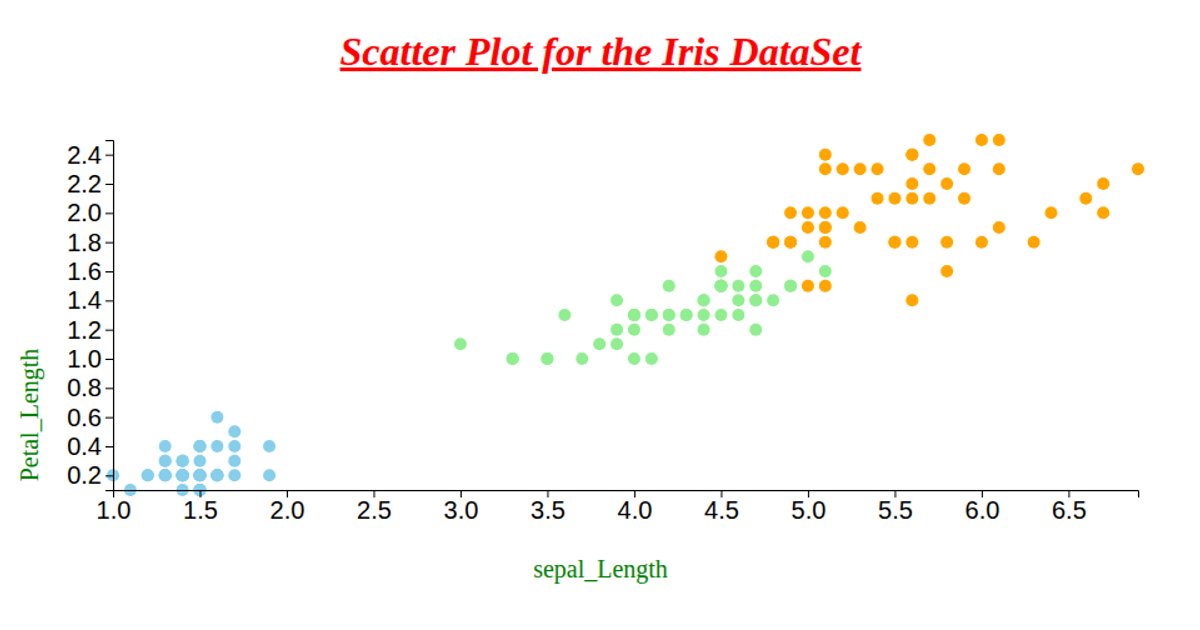
This example renders a single-series area chart from a CSV dataset, showing petal length values across an index. It uses D3 v6 to construct an SVG visualization, with a linear x-scale for the index and a linear y-scale for petal length. The area path is built with `d3.area`, filled in light blue, and the chart includes labeled x and y axes. Data is fetched from a GitHub Gist via `d3.csv`, and the layout is defined by fixed margins and dimensions.
AI-generated descriptionAn example showing the capabilities of VizHub:
- Loads D3 via UNPKG.
- Demonstrates use of
importfrom"d3". - Demonstrates use of
importfrom local ES6 modules.
MIT Licensed



Comments
Sign in to join the discussion.