Barabási–Albert Network Model Visualization
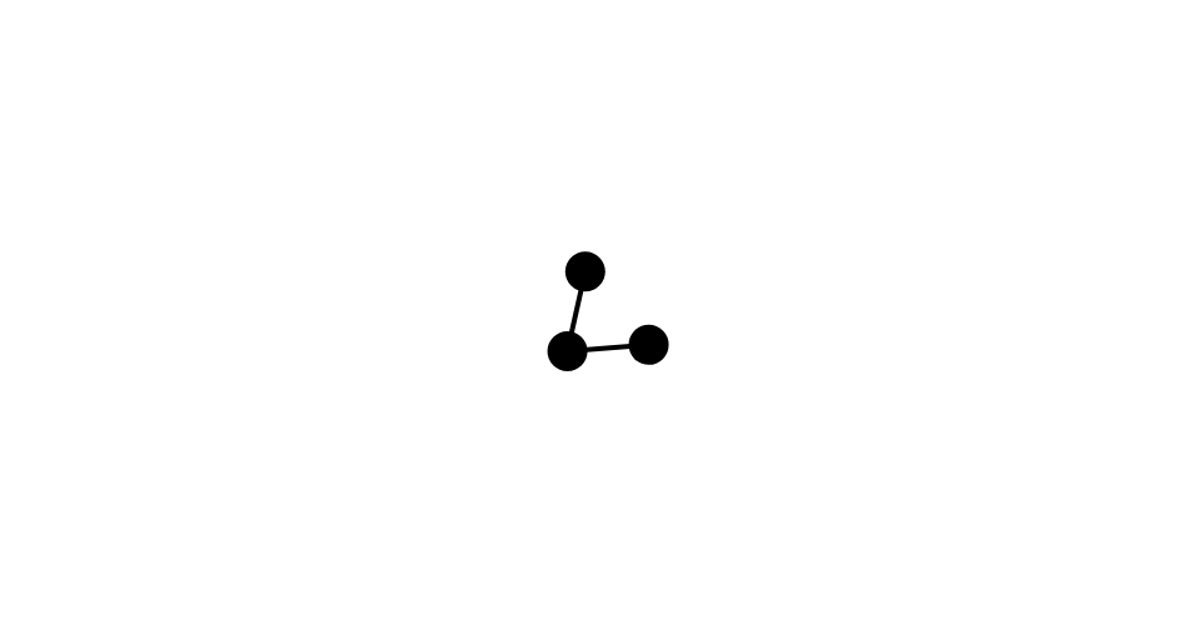
This visualization shows the Barabási–Albert network model growing in real time through preferential attachment, where new nodes connect to existing nodes with probability proportional to their degree. The animation adds a node every 500 milliseconds, building a scale-free network from two initial connected nodes. The force-directed layout is implemented using D3.js v7 with d3.forceSimulation, d3.forceLink, and d3.forceManyBody, rendering nodes as SVG circles that can be dragged. Each new node is positioned randomly within the 960×960 coordinate space, and the simulation restarts with increased alpha after each addition.
AI-generated descriptionBarabási–Albert Network Model Visualization
This visualization demonstrates the Barabási–Albert model for generating scale-free networks using preferential attachment. The algorithm adds a new node to the network every 500ms, connecting it to e
Based on an old implementation.
How it works
- The simulation starts with two connected nodes
- Every 500ms, a new node is added to the network
- The new node connects to existing nodes with probability proportional to their degree (preferential attachment)
- This creates a scale-free network where some nodes become highly connected "hubs"
Features
- Interactive force-directed graph visualization using D3.js
- Nodes can be dragged to explore the network topology
- Auto-scaling as the network grows
- Real-time visualization of the preferential attachment process
- New nodes are positioned randomly within the visual space
This is an implementation of the Barabási–Albert model described at: http://en.wikipedia.org/wiki/BA_model


Comments
Sign in to join the discussion.