Fork of Customizing Axes - D3.js
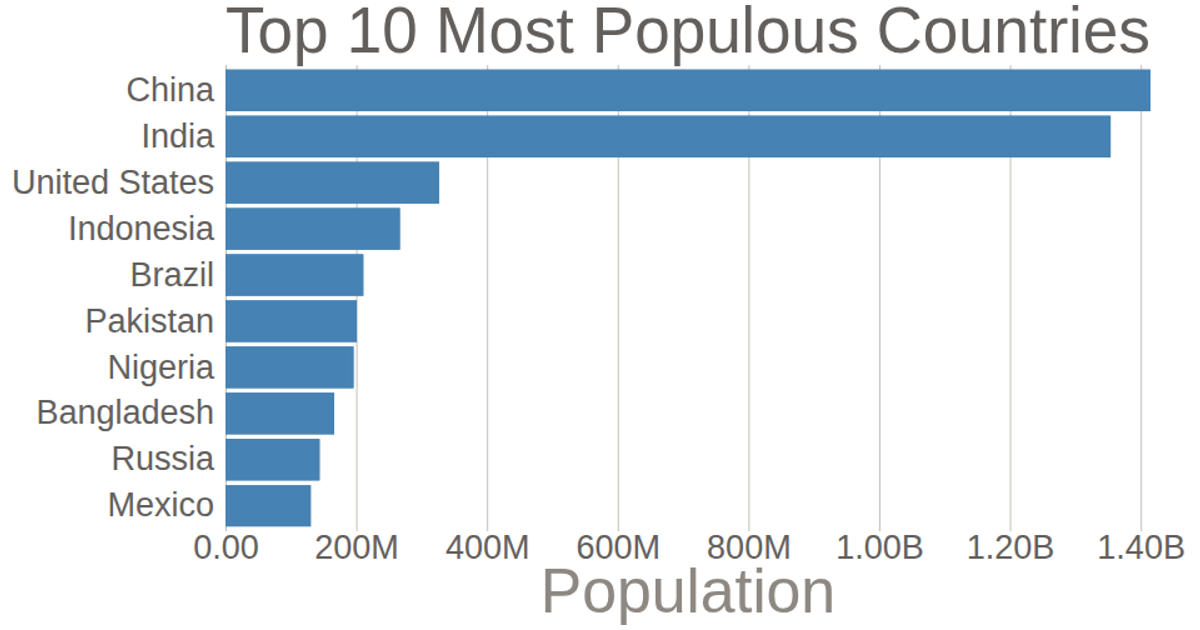
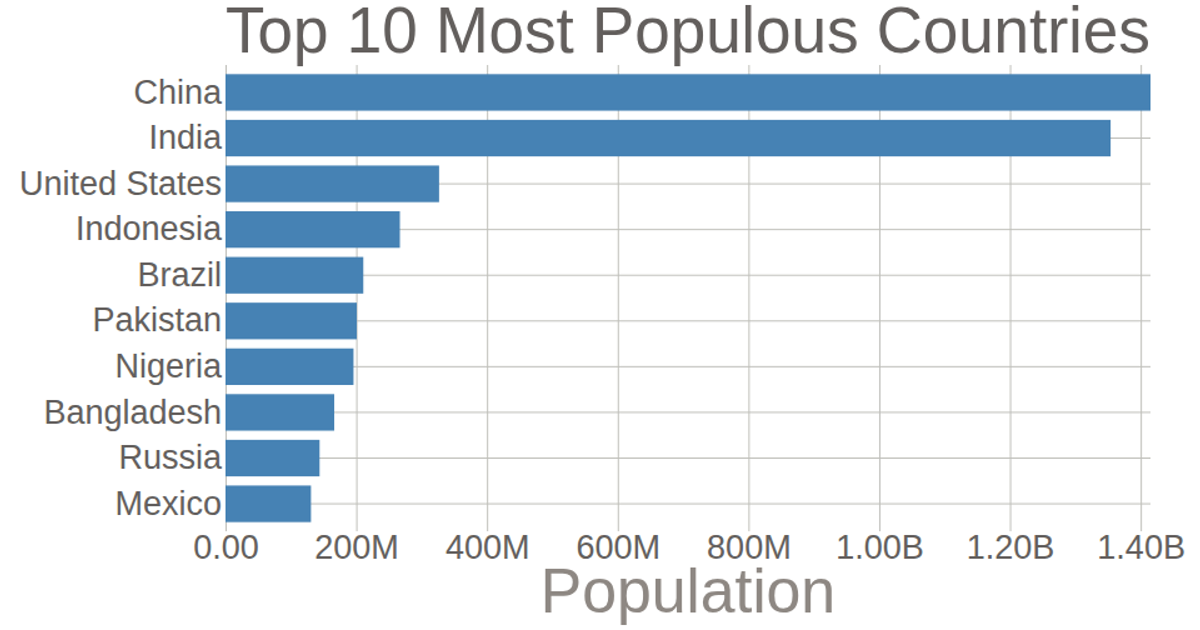
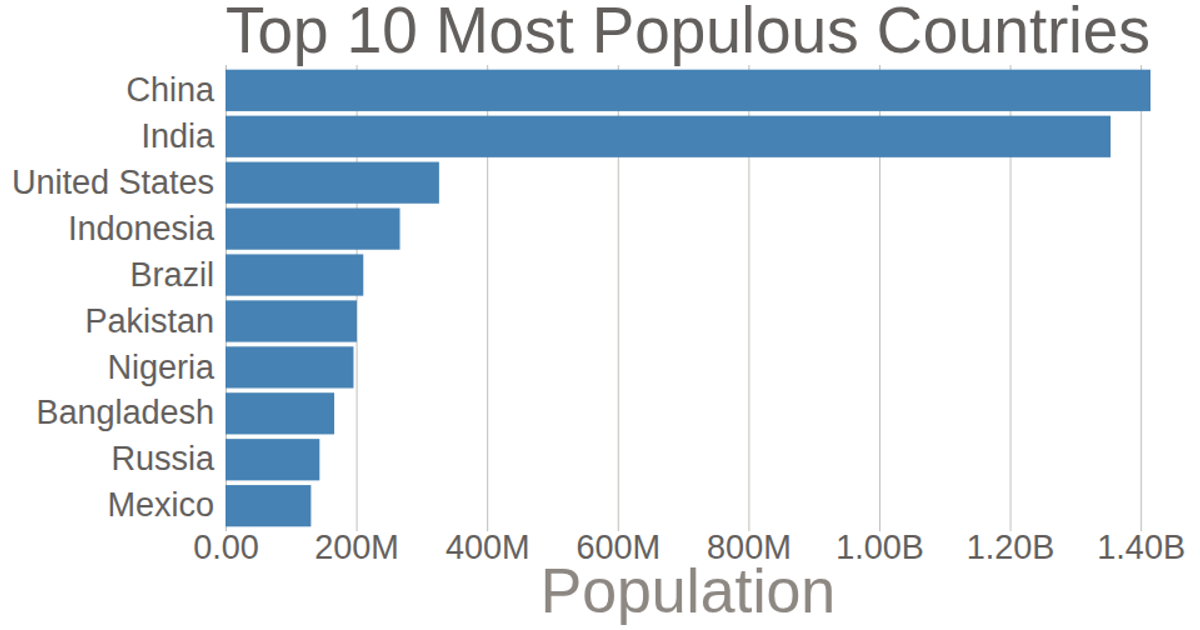
This bar chart displays the population of the top 10 most populous countries, based on 2018 United Nations estimates. It uses D3 v5 to create a horizontal bar chart with SVG, employing `scaleLinear` and `scaleBand` for positioning. The chart customizes D3 axes by removing default tick lines, adding tick marks across the plot, and formatting population numbers using `format('.3s')` to convert values to billions. It also includes custom axis labels and a title, with country names on the y-axis and population values on the x-axis.
AI-generated descriptionThis bar chart shows population of the top 10 most populous countries. The data comes from the year 2018 estimate in United Nations: World Population Prospects 2017. It also demonstrates customization of D3 axes.
See also the first bar chart visualization that this one builds on: Making a Bar Chart.




Comments
Sign in to join the discussion.