🌍 Public
Fork of Vega
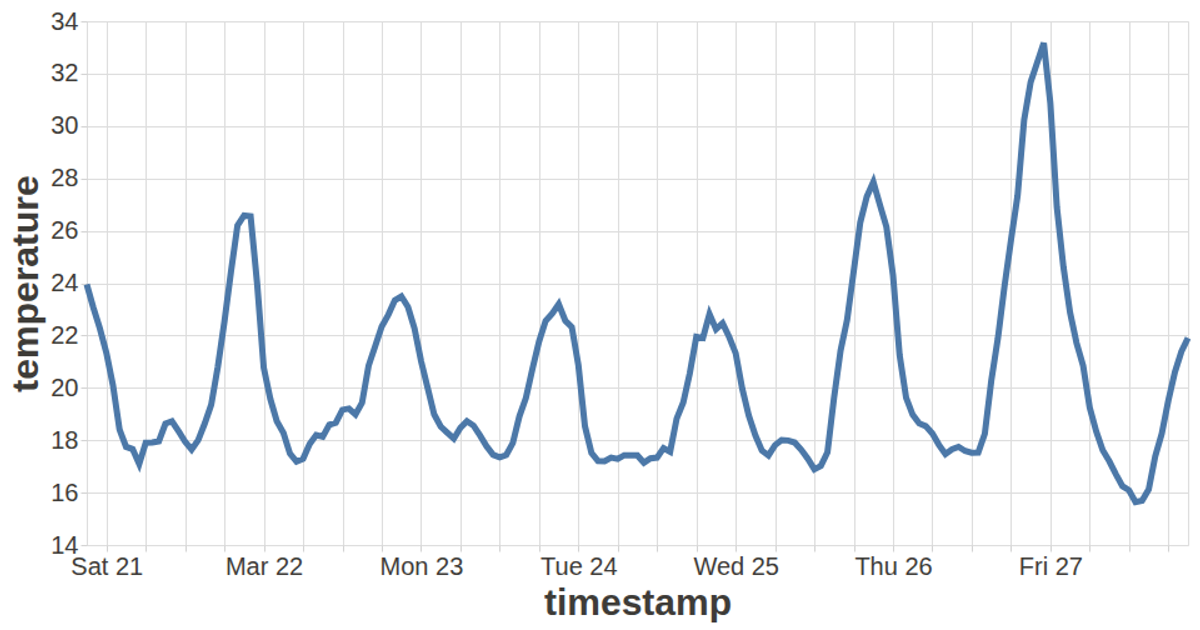
This visualization displays a line chart of weekly temperature data in San Francisco, rendered as a single black line across a dark background. The chart uses a Vega-Lite specification defined through the `vega-lite-api` library, with the line mark encoding timestamp on the x-axis and temperature on the y-axis, both with zero scales disabled. Data is loaded asynchronously using the D3 `csv` function, while the chart is rendered via Vega’s SVG renderer and integrated into a React application. Custom styling for axes and labels is applied through a config object.
AI-generated descriptionVega Lite API
MIT Licensed



Comments
Sign in to join the discussion.