🌍 Public
Fork of World Countries Tree
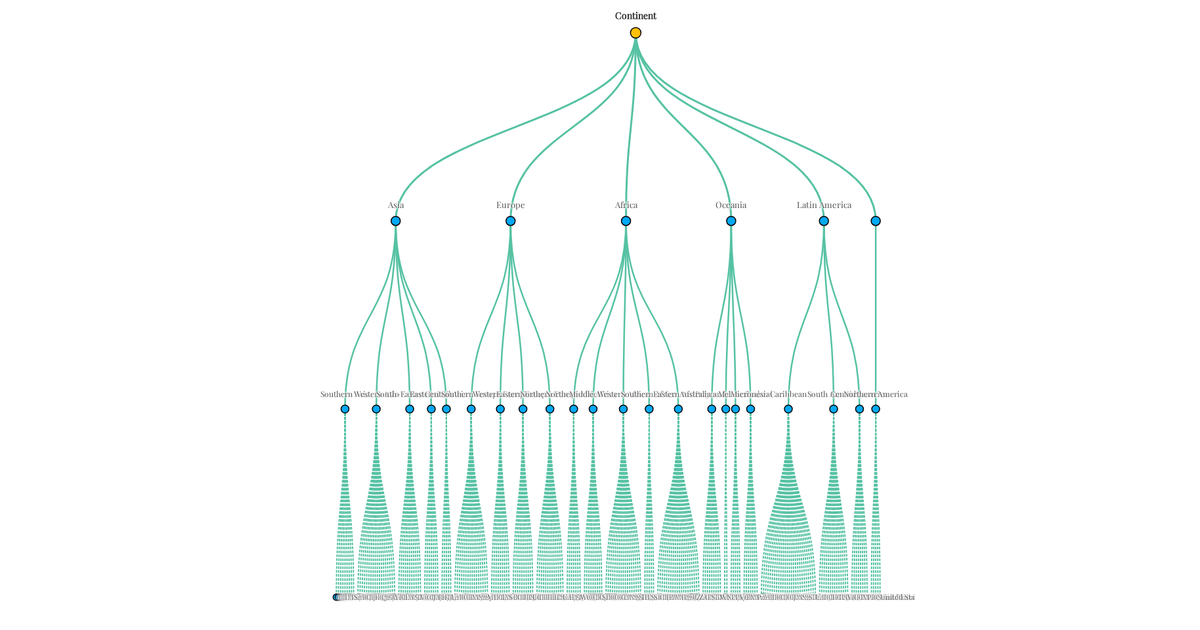
This tree visualization displays a hierarchical dataset of human goals and activities, loaded from local JSON. The graph uses a horizontal dendrogram layout with curved link paths generated by `d3.linkHorizontal`. Node labels are positioned dynamically, with font size scaling inversely to node depth. The SVG canvas is rendered with a light theme using the Playfair Display serif font, and pan/zoom interactions are enabled via the `d3.zoom` API. A video tutorial in the README accompanies the code, which relies on `d3.hierarchy` and `d3.tree` for the layout.
AI-generated descriptionMIT Licensed




Comments
Sign in to join the discussion.