🌍 Public
Marking a Bar Chart
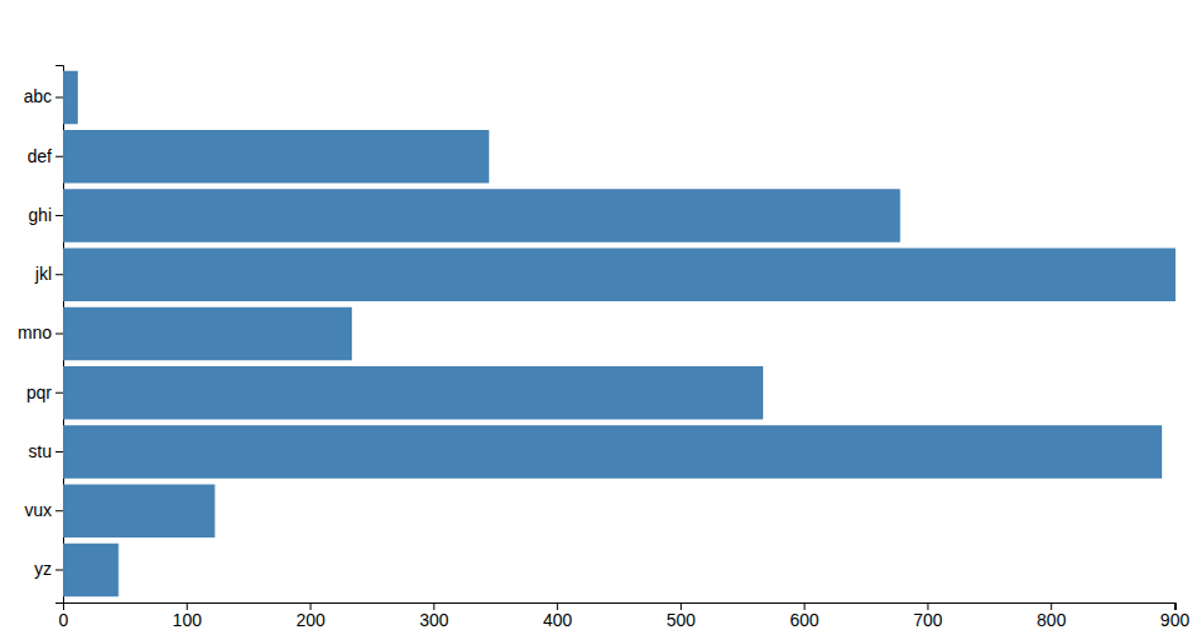
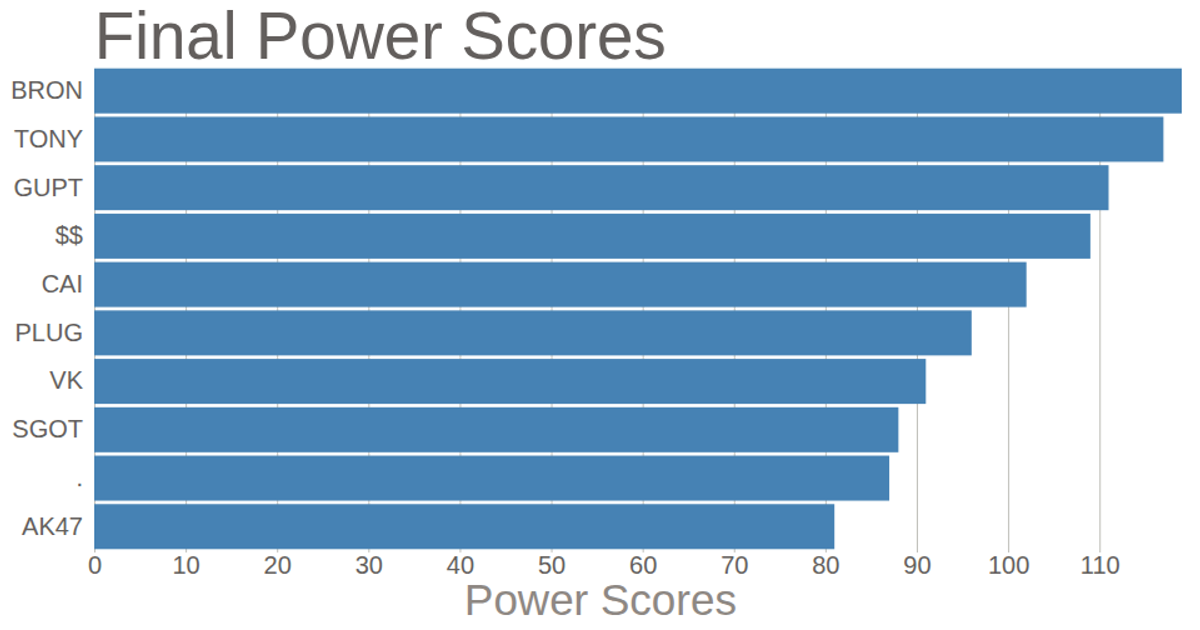
This bar chart displays survey results ranking ideas by the number of “fucks given,” with values from 2 to 10 across five categories. Horizontal bars are rendered as SVG rectangles, scaled linearly by value and positioned vertically using a band scale. The visualization uses d3.scaleLinear, d3.scaleBand, d3.axisLeft, and d3.axisBottom to construct axes and encode data from a CSV file, with each bar’s width proportional to its numeric value.
AI-generated descriptionMIT Licensed



Comments
Sign in to join the discussion.