🌍 Public
World Countries Tree
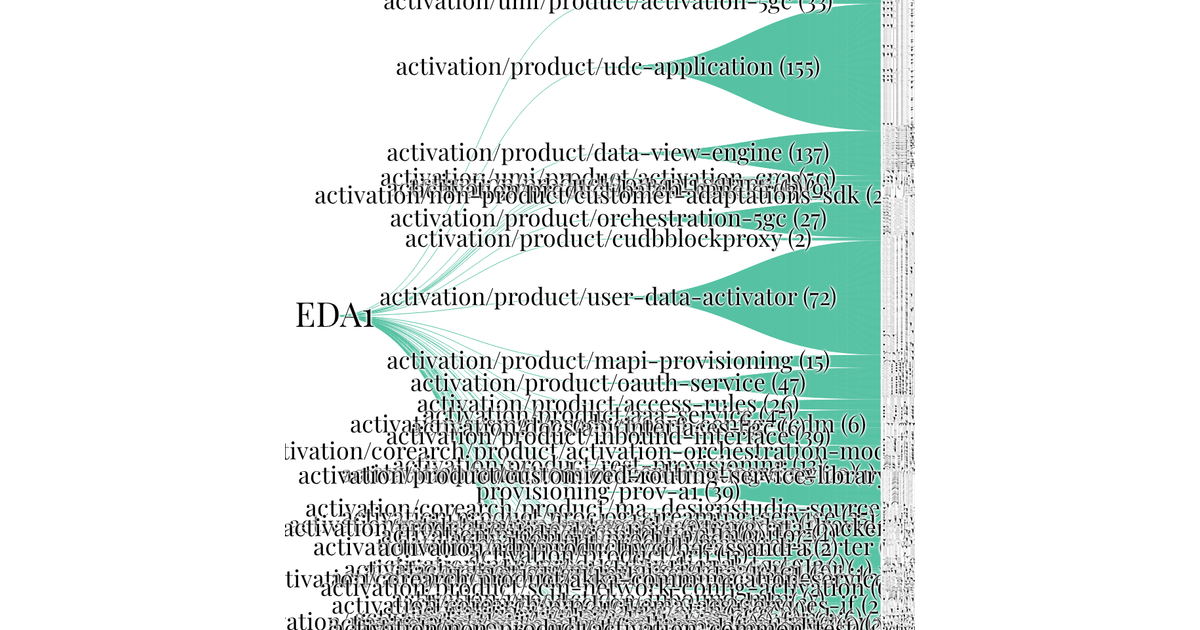
This example renders a hierarchical dataset of software components as an interactive tree diagram. The visualization uses D3 v5’s `tree` layout and `linkHorizontal` generator to position nodes and draw curved links, with text labels sized inversely to depth. Pan and zoom are enabled via `d3.zoom`, applied to a group containing all elements. The code loads data from a local JSON file and renders entirely in SVG, providing an overview of product groupings from the "Release" root down through "gerrit-central" to individual activation paths.
AI-generated descriptionMIT Licensed



Comments
Sign in to join the discussion.