🌍 Public
Activity6 Question3
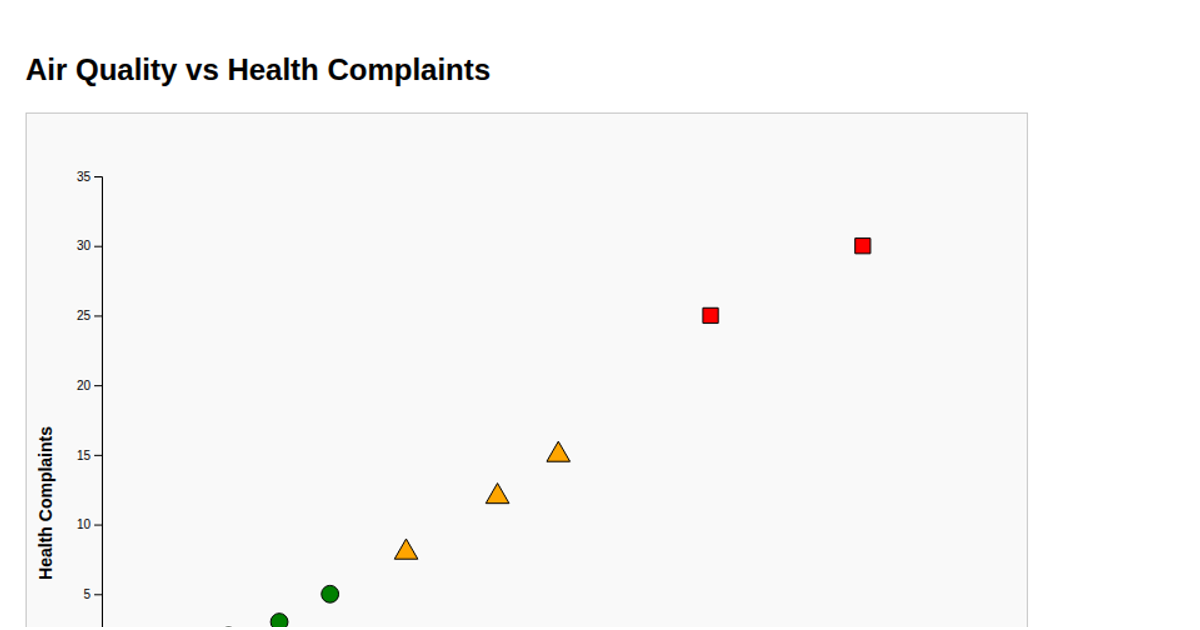
This scatterplot visualizes the Alerts dataset, plotting the number of bugs against days, with each point colored and shaped according to criticality. Critical priority points appear as red squares, Medium as green diamonds, High as blue circles, and others as black triangles. The visualization uses D3 v6 to load CSV data, apply linear scales for axes, and render SVG symbols via `d3.symbol` with distinct `symbolSquare`, `symbolDiamond`, `symbolCircle`, and `symbolTriangle` types. Axis labels are generated with `axisLeft` and `axisBottom`.
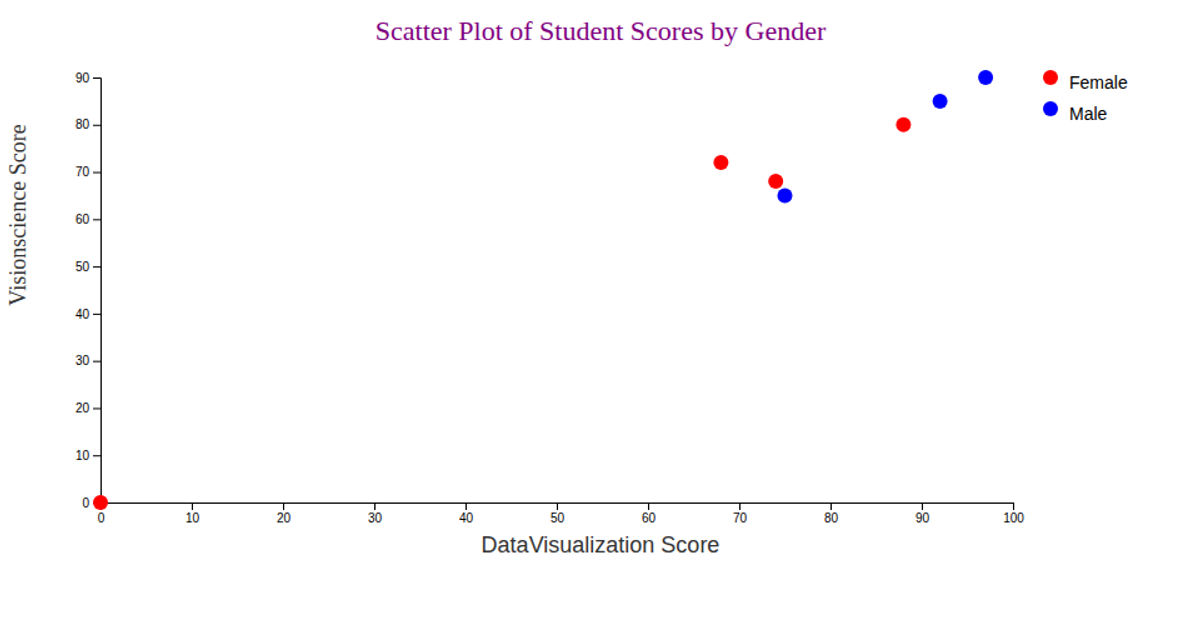
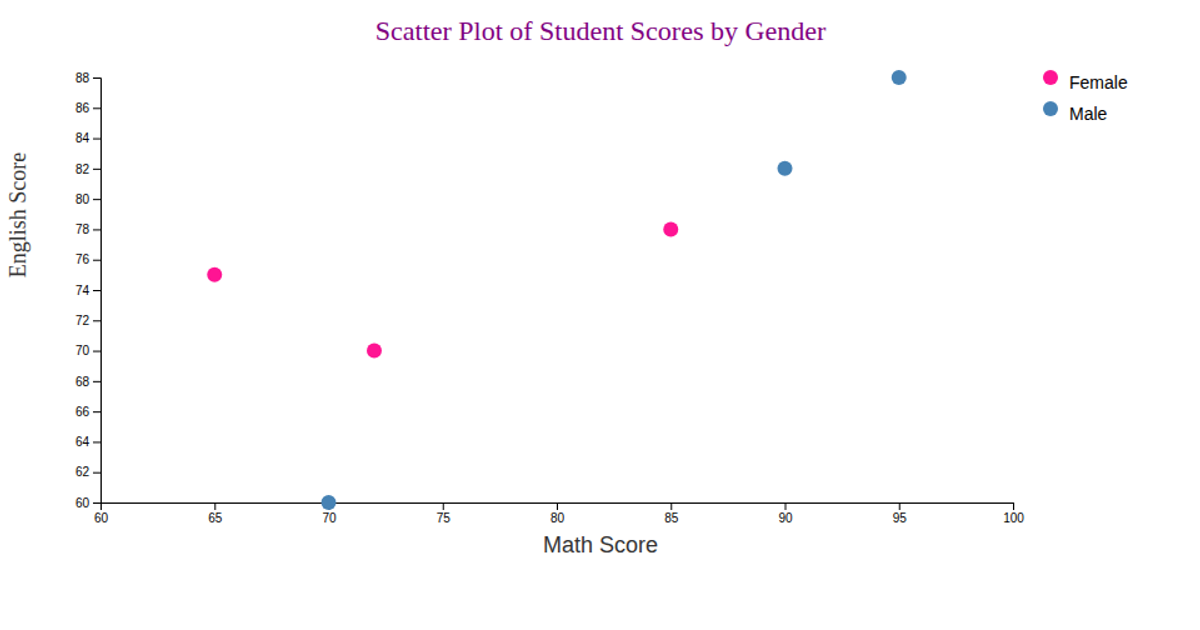
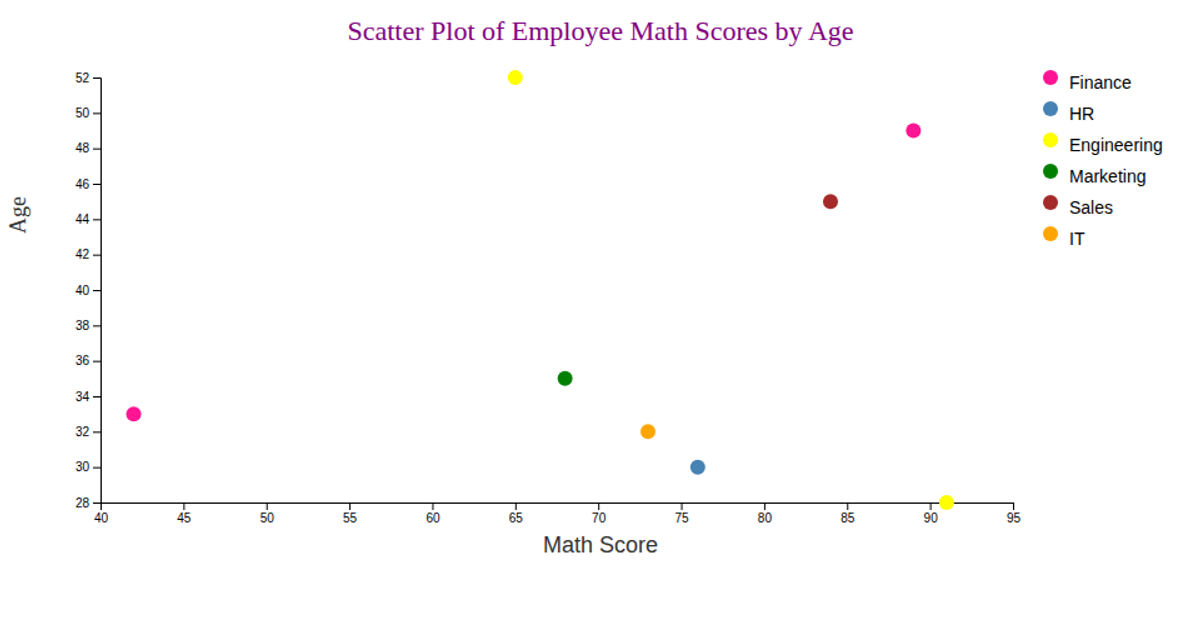
AI-generated descriptionWe are Displaying the Alerts dataset using Scatter plot.
MIT Licensed




Comments
Sign in to join the discussion.