🌍 Public
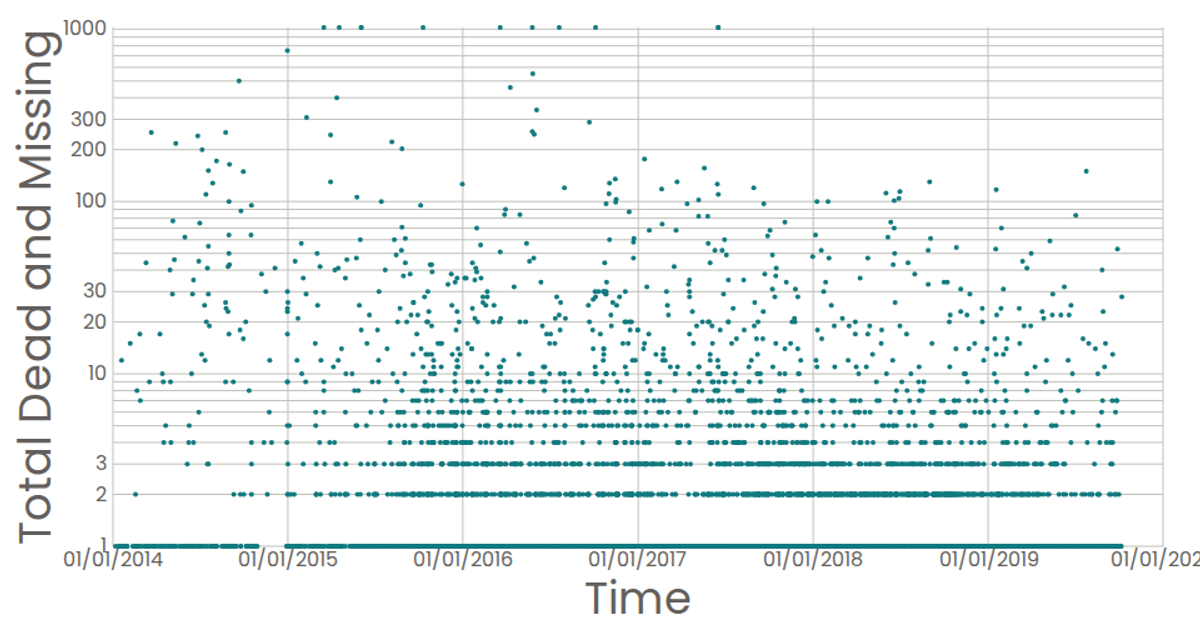
Mssing Migrants Scatter Plot Log Scale
This example visualizes the "Total Dead and Missing" from the Missing Migrants Global dataset as a scatter plot with a logarithmic y-axis, plotted over time. The SVG rendering uses React and D3 v6, with scales created via `d3.scaleTime` and `d3.scaleLog`. A path connects the points using `d3.line` with natural curve interpolation, while circles provide hover tooltips formatted with `d3.timeFormat`.
AI-generated descriptionA line chart of San Francisco Daily Temperature Dataset.
MIT Licensed




Comments
Sign in to join the discussion.