🌍 Public
ICE-5
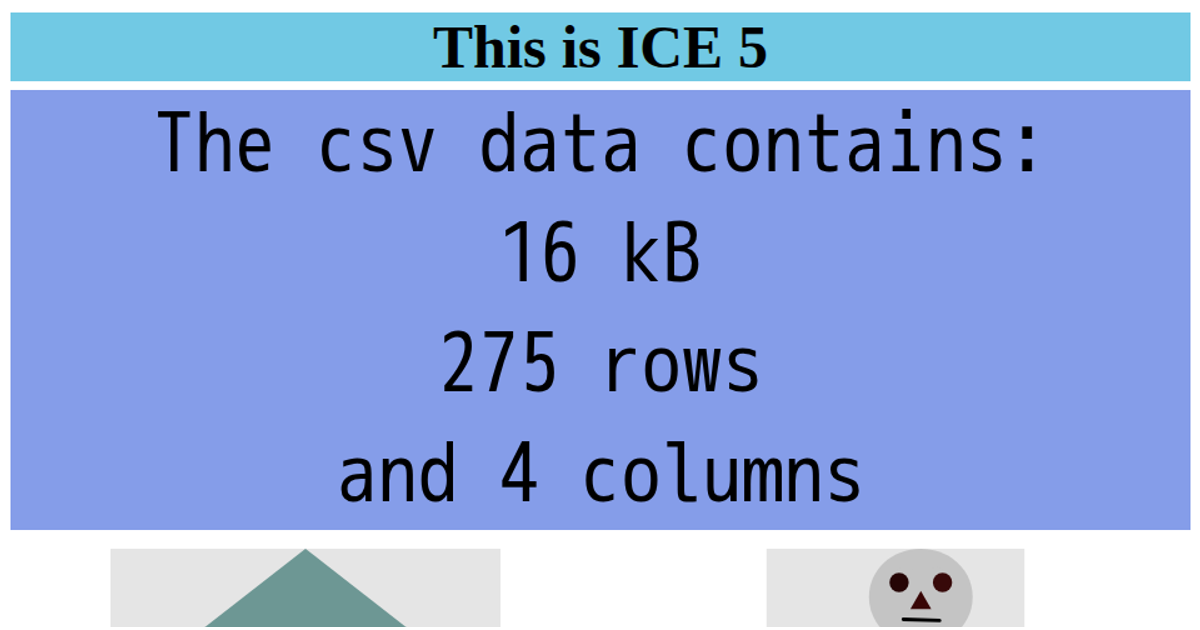
This visualization displays metadata about a water treatment plant valve dataset, showing file size, row count, and column count via D3’s `d3.csv` and `d3.csvFormat` APIs. The page presents the information in a large, white preformatted text block over an animated gradient background and a landscape SVG image. It includes a clickable link to the raw CSV data hosted in a GitHub gist, styled with custom CSS for typography and layout.
AI-generated descriptionMIT Licensed



Comments
Sign in to join the discussion.