🌍 Public
D3Pie
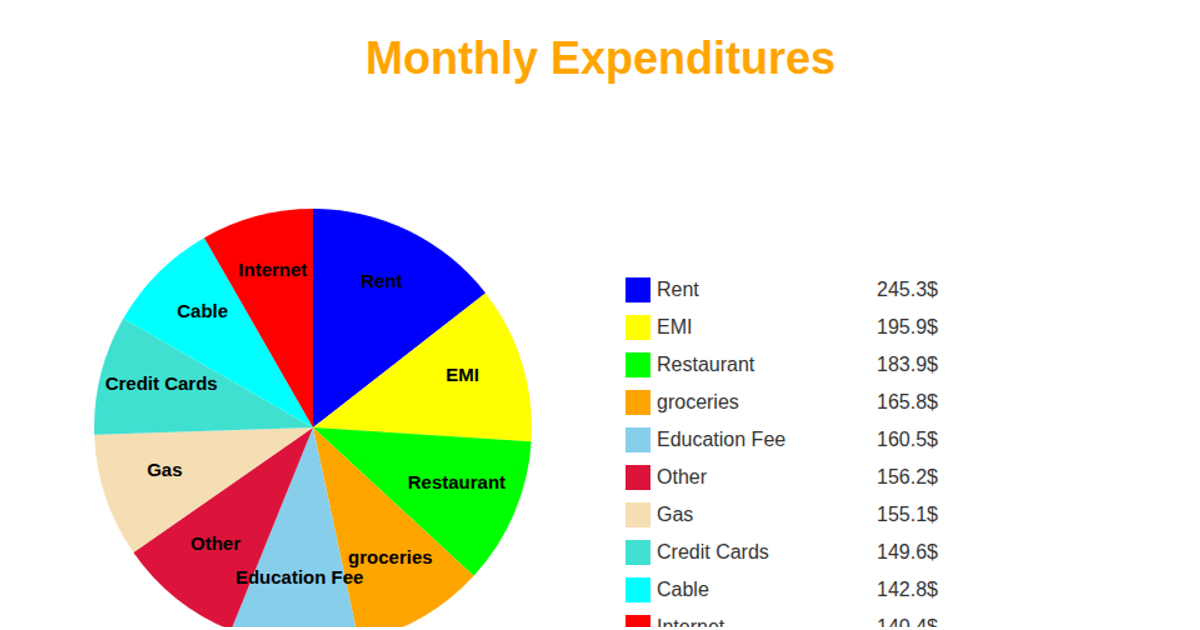
This example visualizes monthly product sales data for Costco in New York as a pie chart. Each slice represents a product, with its size proportional to units sold, and is labeled with the corresponding value in thousands. A legend lists product names and their sales figures. The chart is rendered as SVG using D3 v5, creating the pie with `d3.pie` and `d3.arc`, coloring slices with `d3.scaleOrdinal`, and loading data from a raw GitHub CSV file.
AI-generated descriptionMIT Licensed





Comments
Sign in to join the discussion.