🌍 Public
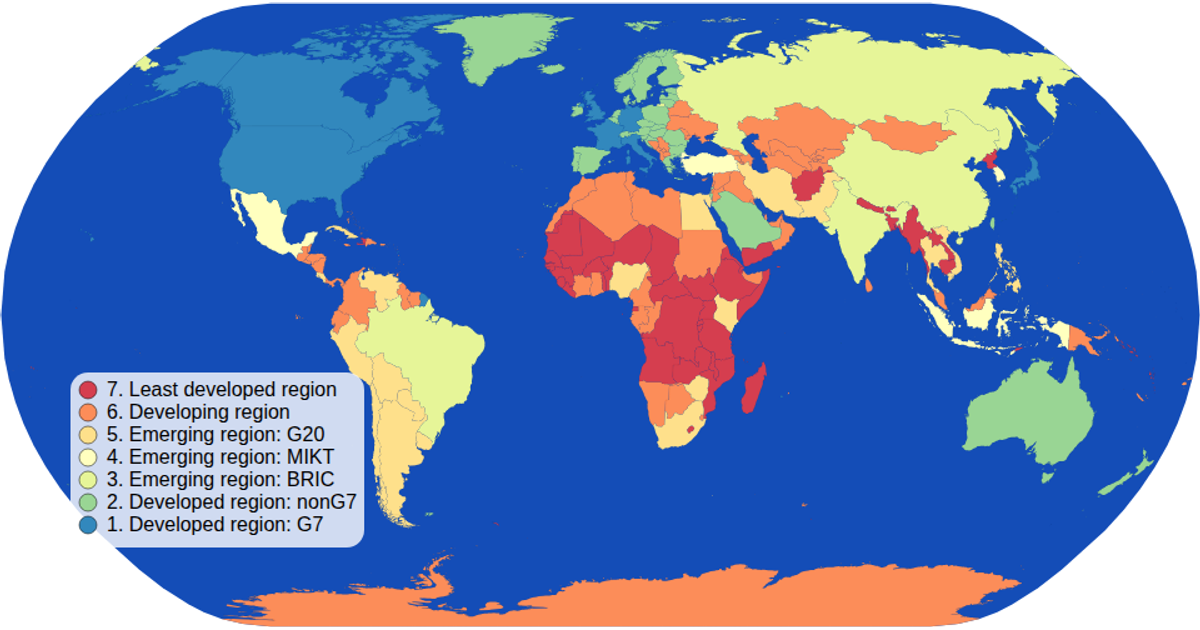
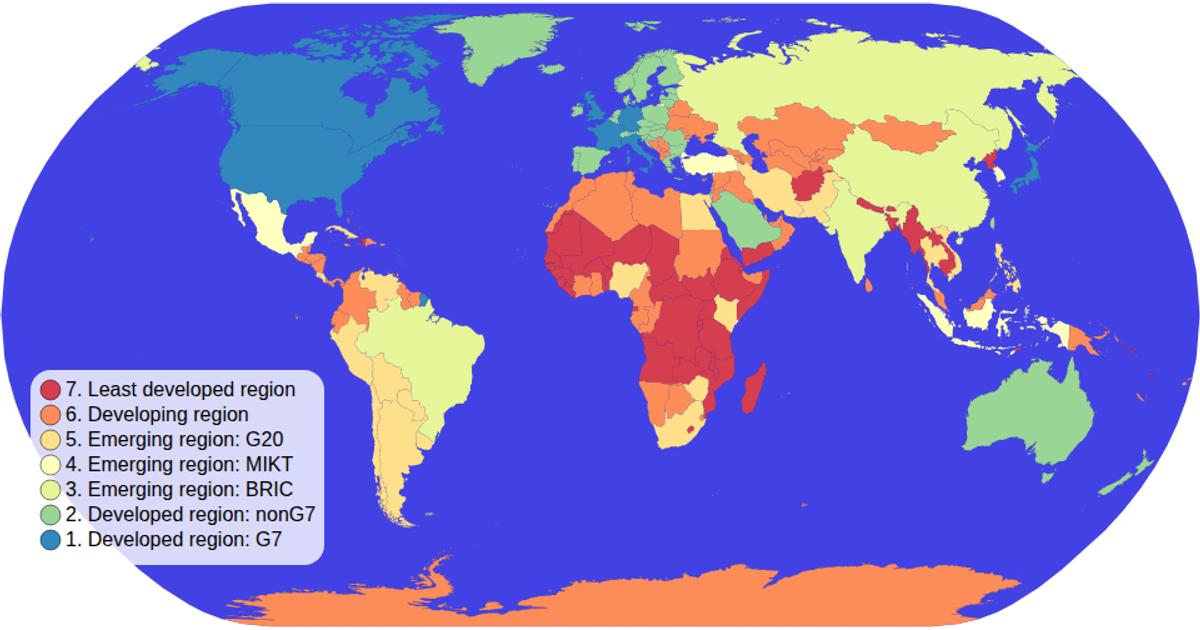
Choropleth Map with Interactive Filtering
A choropleth map displays countries colored by their economy category, with an interactive color legend for filtering. Clicking a legend category highlights only matching countries in full color while dimming others. The visualization uses d3.scaleOrdinal with schemeSpectral for color encoding and d3-geo projections for rendering SVG paths from TopoJSON world data. The legend implements click handling and opacity filtering, while hover states change country fill colors.
AI-generated descriptionMIT Licensed




Comments
Sign in to join the discussion.