🌍 Public
Assignment2_Q2_AreaChart_Rashmitha
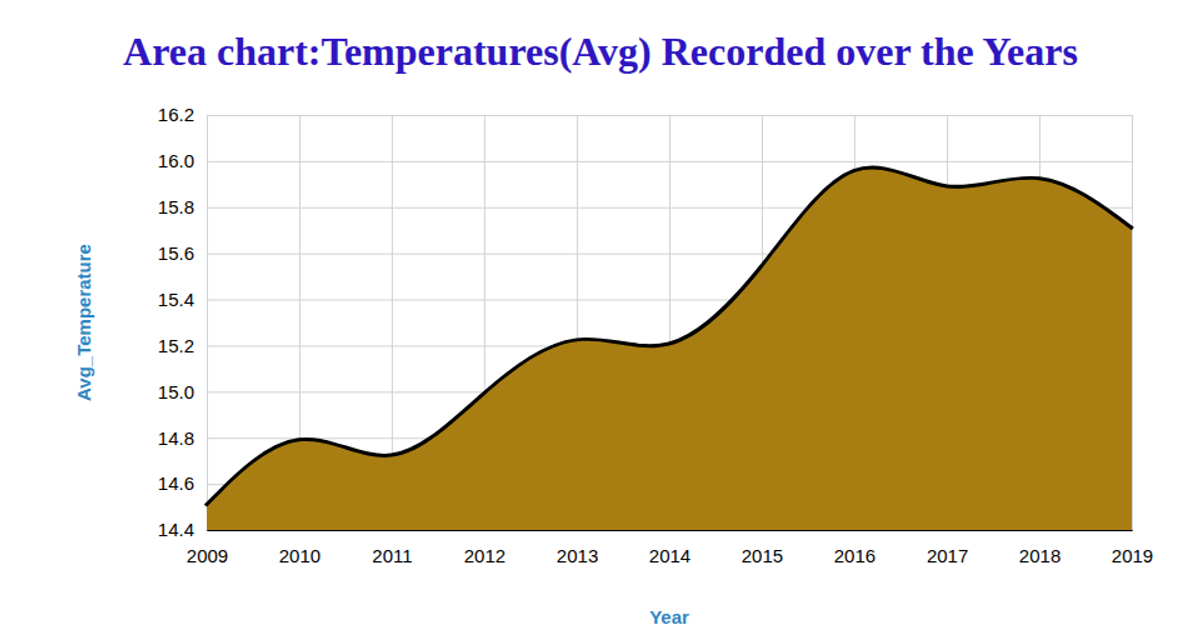
This chart visualizes Seattle’s yearly temperature data as a stacked area chart, showing maximum, mean, and minimum temperatures over time with color-coded layers and a legend. Built using D3 v7, it loads a CSV from GitHub, parses dates, and uses `d3.stack`, `d3.area`, and `d3.scaleOrdinal` to render the areas. The SVG chart includes axis labels and a hover tooltip that uses `d3.pointer` with `x.invert` to display exact temperature values for each year.
AI-generated descriptionMIT Licensed


Comments
Sign in to join the discussion.