🌍 Public
Fork of Penguins dataset
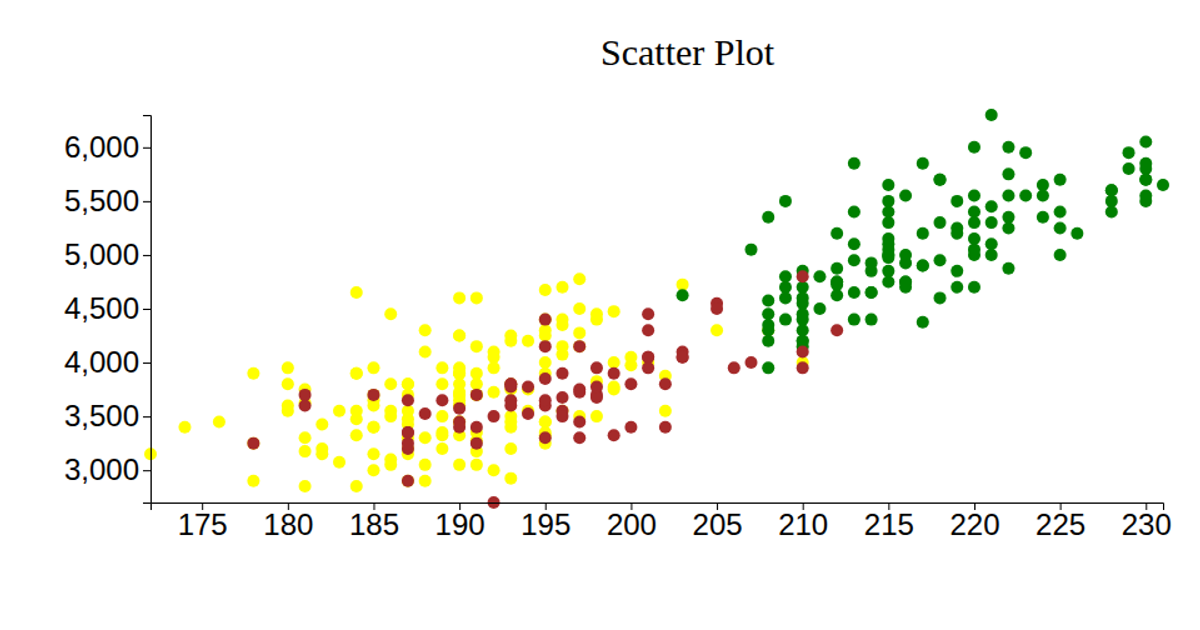
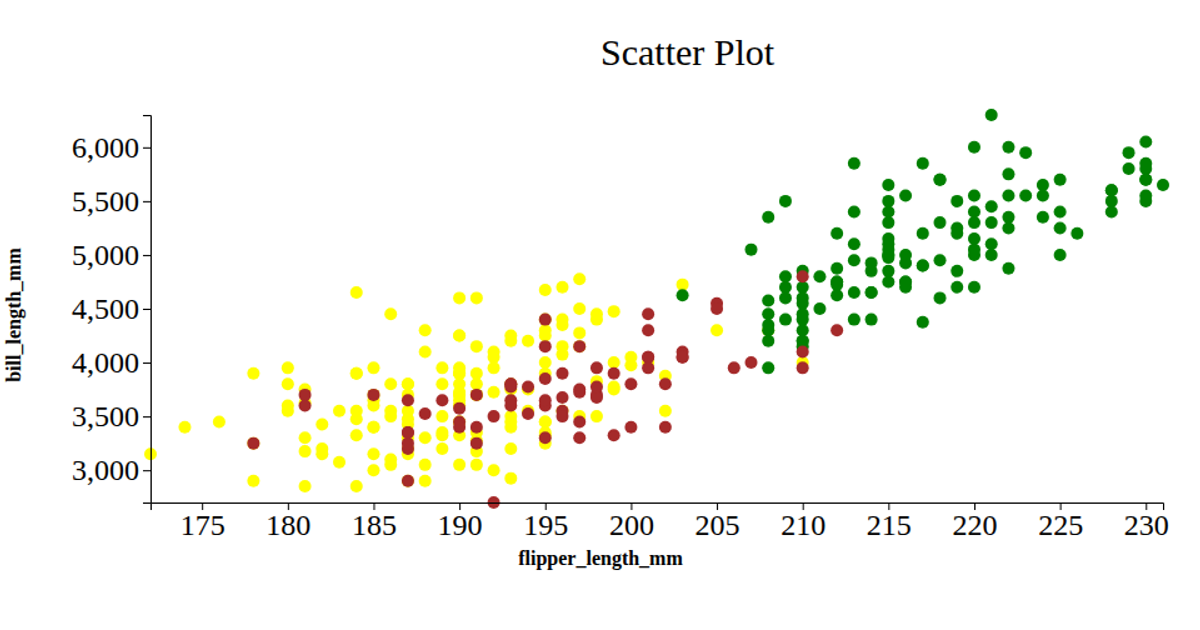
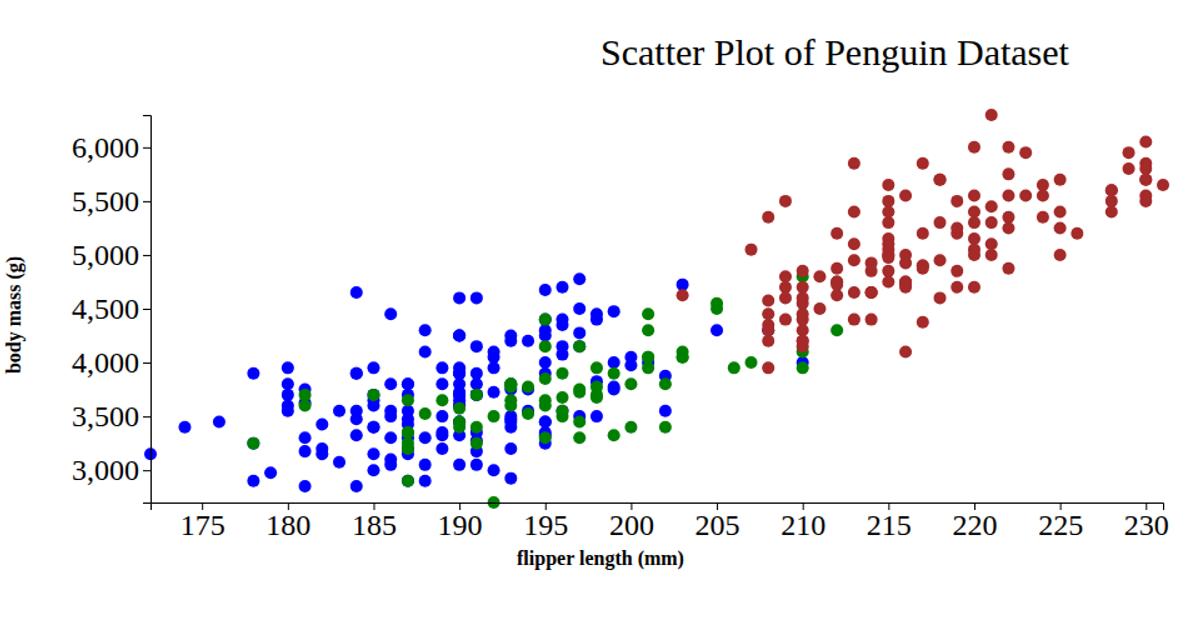
This scatter plot visualizes the Palmer Penguins dataset, mapping flipper length on the x-axis and body mass on the y-axis, with each point colored by penguin species. The chart also encodes bill length and bill depth as additional attributes. Built with D3 v5, it uses `d3.csv` to load the data, `d3.scaleLinear` for axes, and renders circles via SVG, with axis labels and a title styled in HTML.
AI-generated descriptionMIT Licensed



Comments
Sign in to join the discussion.