🌍 Public
Fork of ICE-5: Loading and Parsing CSV Data with D3.js
YYbg99g
Last edited Feb 28, 2022
Created on Feb 27, 2022
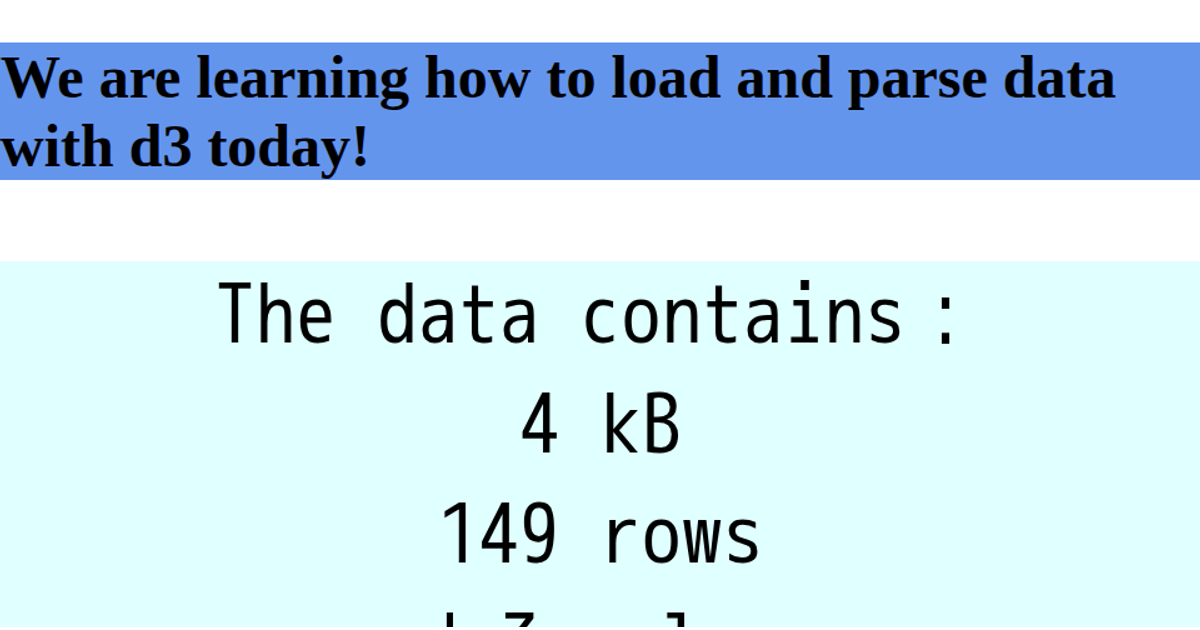
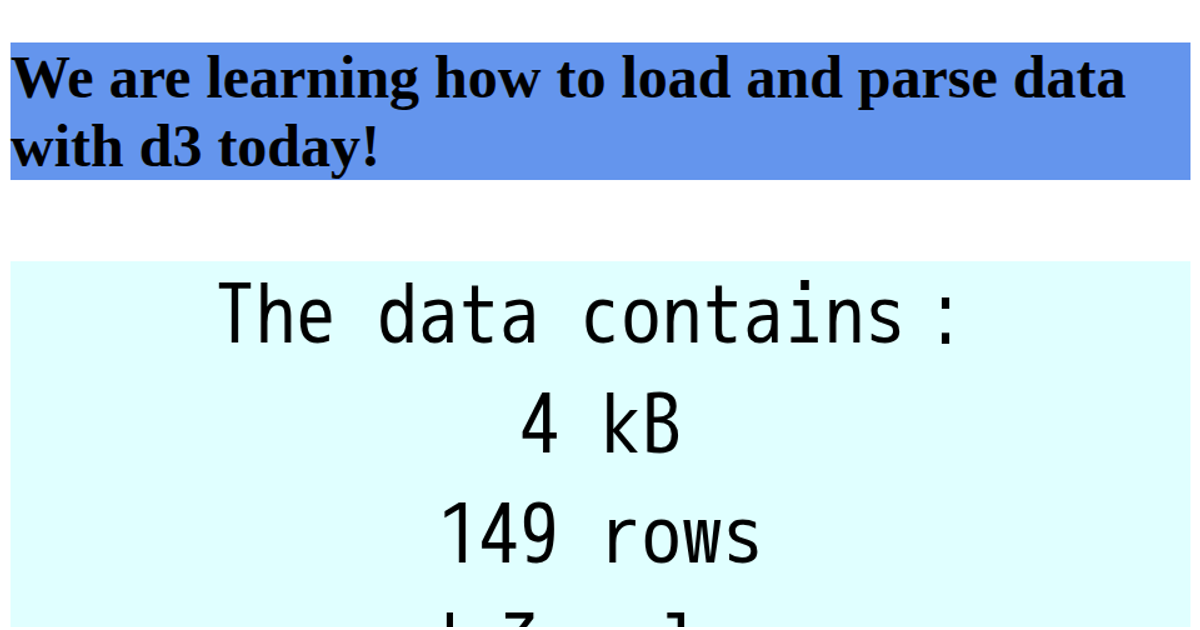
This example demonstrates loading and parsing CSV data with D3.js, displaying a message about the dataset's size and structure. The page uses D3.v7's `d3.csv` function to fetch an external CSV file of earthquake data, then computes and reports the file size in kilobytes, the number of rows, and the number of columns. The results appear in a large `<pre>` element, styled with CSS. The page also includes an inline SVG and a reference to an external image, though the core interactive component is the asynchronous data loading and formatting via `d3.csvFormat`.
AI-generated descriptionA bare minimum HTML page demonstrating use of CSS and JavaScript.
See also React Starter.
MIT Licensed




Comments
Sign in to join the discussion.