🌍 Public
Scatterplot for peng bird dataset
FFremont
Last edited Apr 30, 2024
Created on Apr 30, 2024
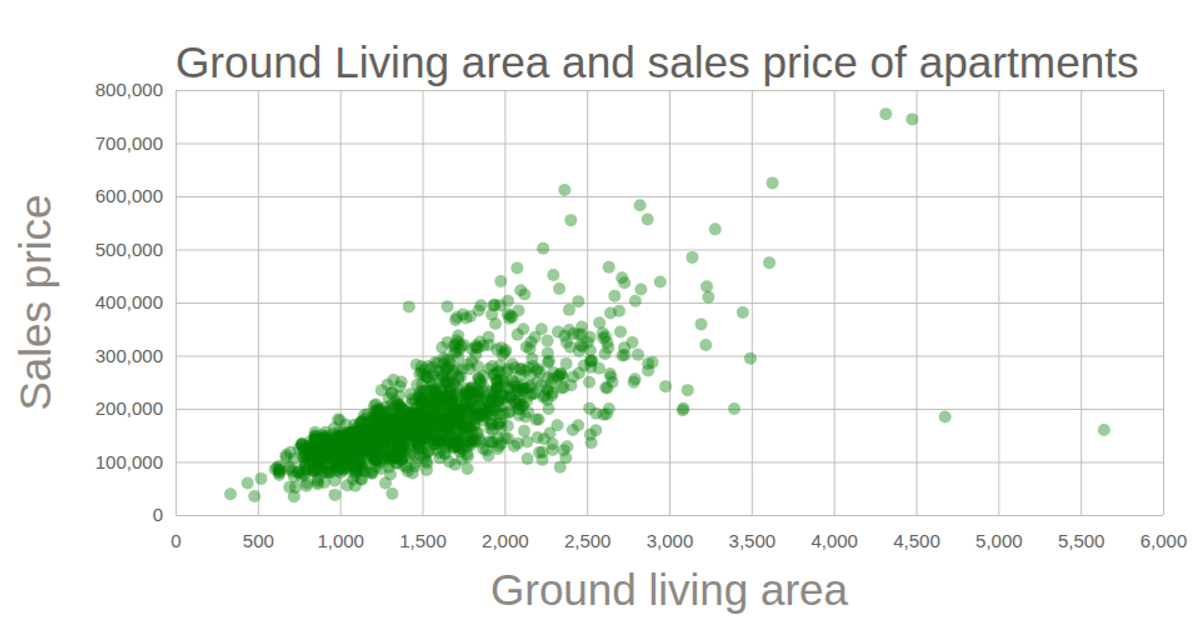
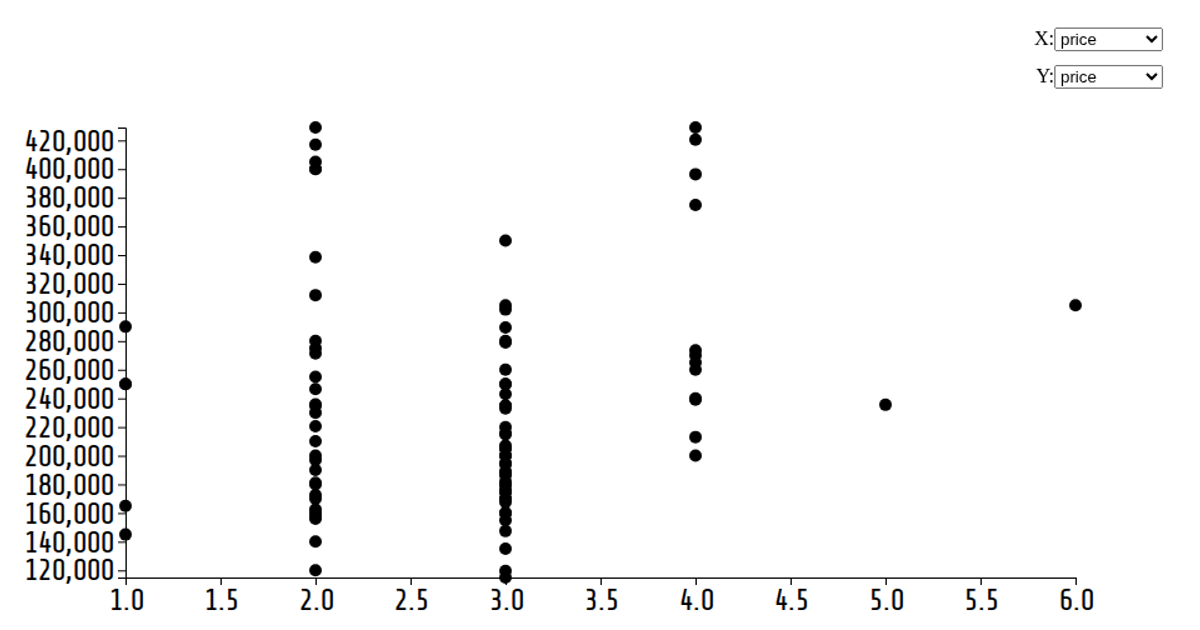
This scatterplot visualizes the relationship between ground living area and sale price for properties from the world-data-2023.csv dataset. Each circle represents a data point, with position determined by the d3.scaleLinear mappings for the x and y axes. The visualization uses d3.js v6 within a React framework, rendering as an SVG. The code loads data via d3.csv, creates axes with d3.axisBottom and d3.axisLeft, and appends circles with attributes for x, y, and radius.
AI-generated descriptionA bare minimum HTML page demonstrating use of CSS and JavaScript.
See also React Starter.
MIT Licensed



Comments
Sign in to join the discussion.