🌍 Public
Improved Scatterplot with Interactive Color Legend
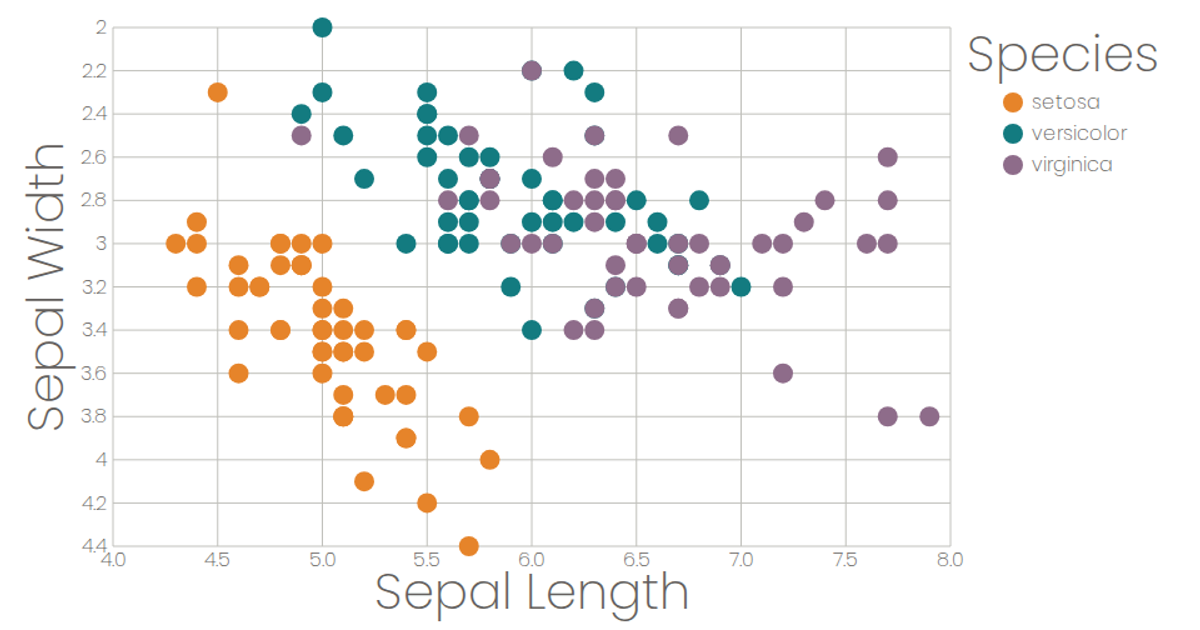
This interactive scatterplot visualizes Fisher’s Iris dataset, loaded via `d3.csv` from a GitHub Gist. The React app uses `d3.scaleLinear` for axes, `d3.scaleOrdinal` for species colors, and custom SVG components for ticks and marks. Users select X and Y attributes from dropdowns, while hovering over the interactive color legend dims non-matching points via React state, highlighting each species’ distribution.
AI-generated descriptionA scatterplot of the Iris Data Set loaded as a .csv from GitHub Gist
MIT Licensed




Comments
Sign in to join the discussion.