🌍 Public
Untitled
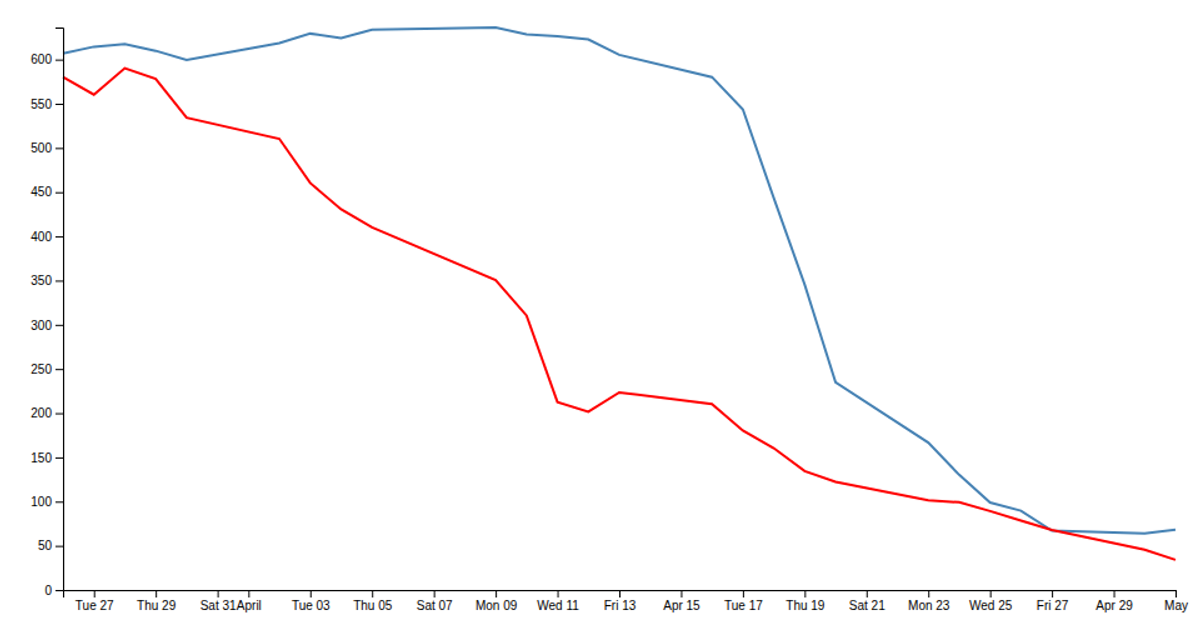
This visualization plots demand and supply curves as red and blue monotone lines against price and quantity axes, using a small CSV dataset. The chart displays the inverse relationship between demand and supply, with labels positioned at the end of each curve. Built with D3 v5, the code uses `d3.csv` to load data, `d3.scaleLinear` for both axes, and `d3.line` with `d3.curveMonotoneX` to generate the SVG paths. Axis labels and curve annotations are added manually via SVG text elements.
AI-generated descriptionMIT Licensed



Comments
Sign in to join the discussion.