🌍 Public
P1 - Task 1
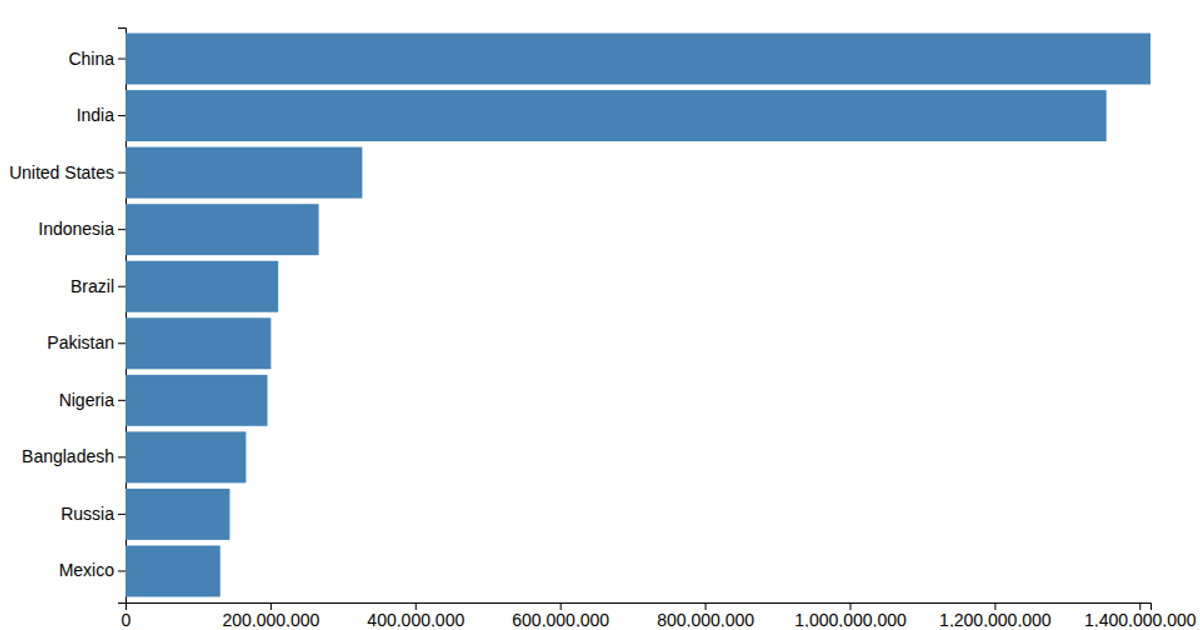
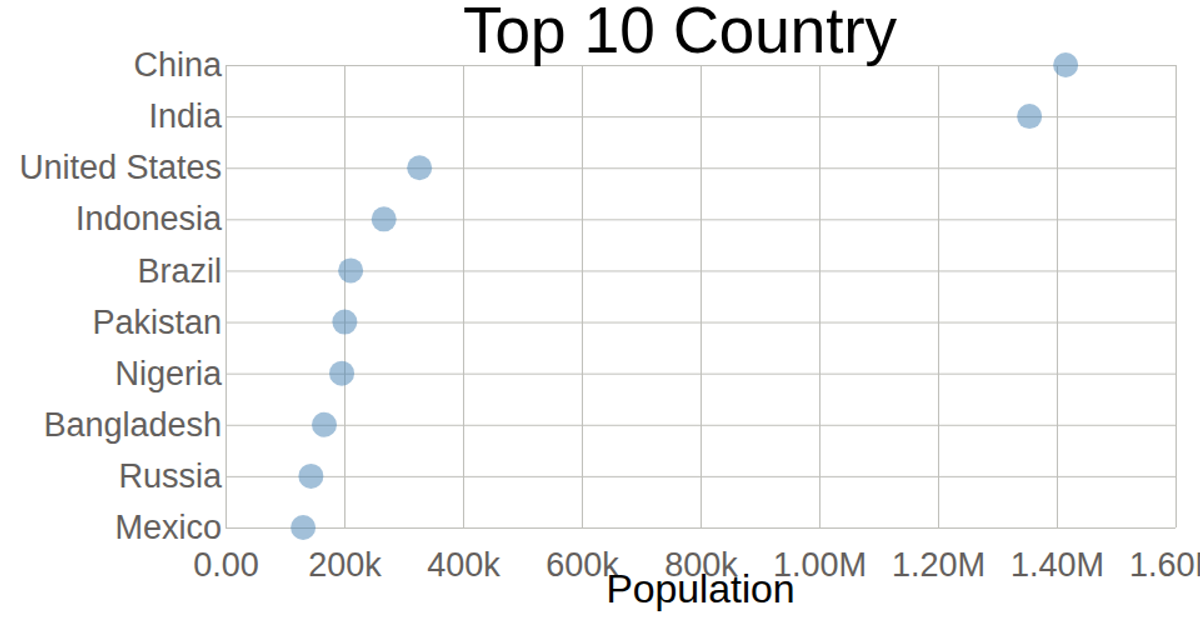
This chart displays the population of the top 10 most populous countries in 2018, using data from the United Nations World Population Prospects 2017. Bars are rendered as SVG rectangles, colored steelblue. The visualization uses D3.js (version 5.12) with its `select`, `csv`, `scaleLinear`, `max`, `scaleBand`, `axisLeft`, `axisBottom`, and `format` modules for data binding, scaling, and plotting the axes, though the shown JavaScript focuses on a separate dynamic circle-updating example.
AI-generated descriptionThis bar chart shows population of the top 10 most populous countries. The data comes from the year 2018 estimate in United Nations: World Population Prospects 2017. It also demonstrates customization of D3 axes.
MIT Licensed





Comments
Sign in to join the discussion.