🌍 Public
so lewit reproduction using D3.js inbuilt shape 2
Ddeebanks77
Last edited Nov 23, 2022
Created on Nov 23, 2022
Forked from so lewit reproduction using D3.js inbuilt shape
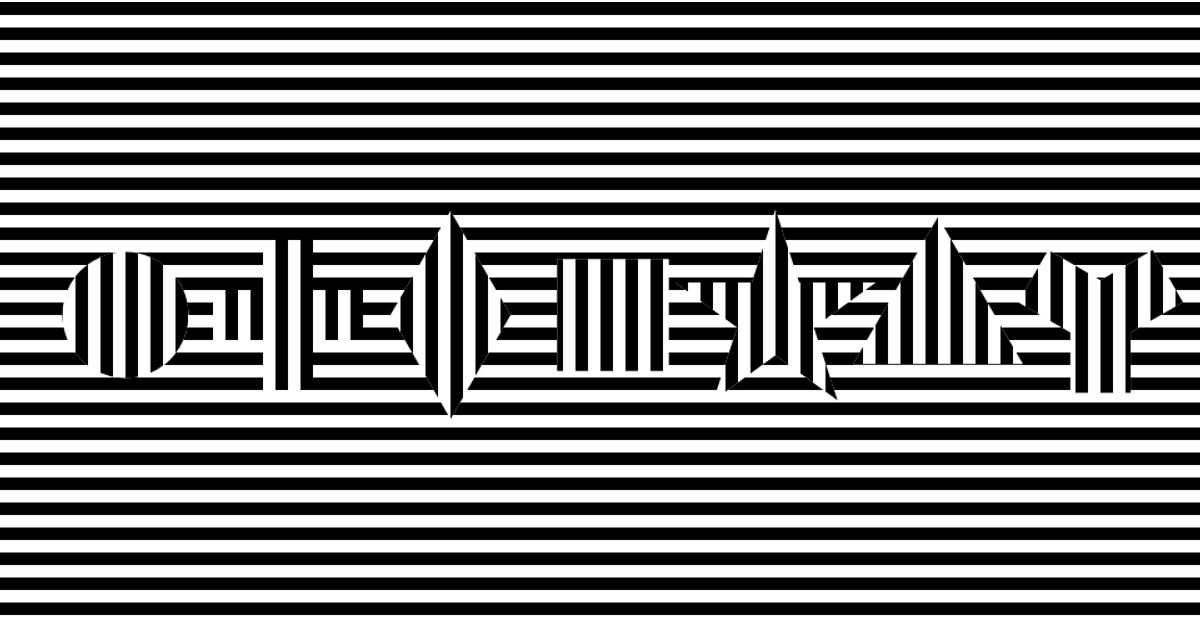
This example reproduces a Sol LeWitt-inspired drawing using D3.js v7, rendered as SVG. It displays two perpendicular sets of thin horizontal and vertical rectangles that form a dense grid over the full viewport. Two circular masks—created with `svg.append("mask")`, `symbol(symbolCircle)`, and inverted black-and-white fills—cut overlapping circular holes in the grid, revealing the background. The code uses `select`, `range`, `join`, and `attr` to generate 100 rectangles per axis, with the `symbolCircle` path defining the mask shapes.
AI-generated descriptionSunrise/sunset.
MIT Licensed




Comments
Sign in to join the discussion.