🌍 Public
FCC Scatter Plot
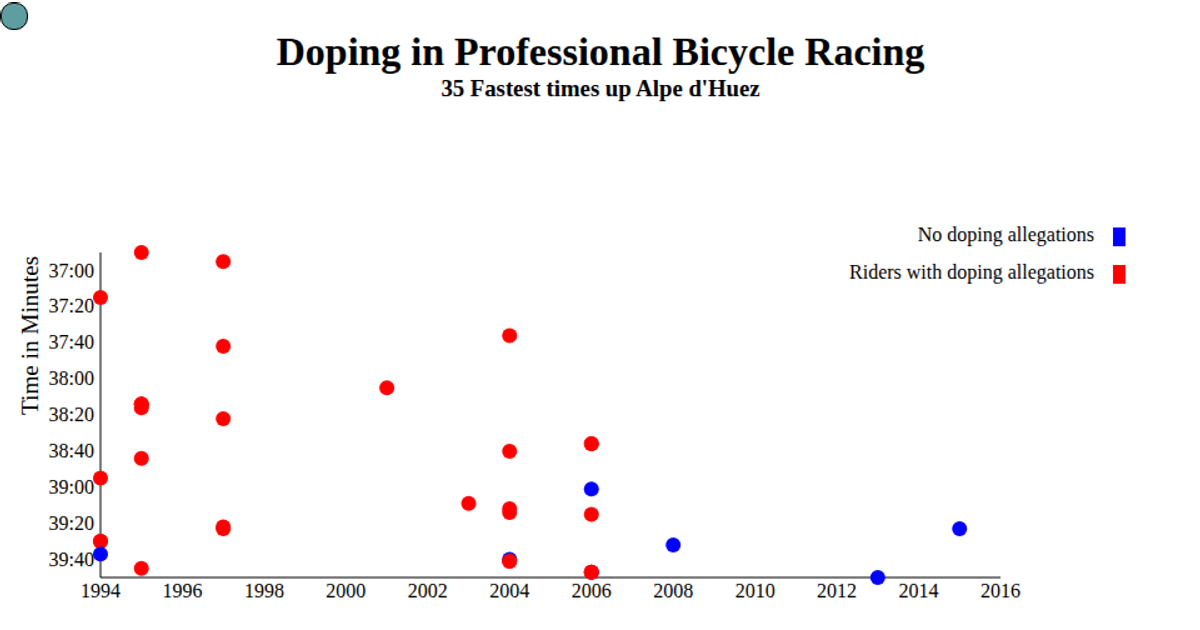
This scatter plot visualizes cyclist performance data from the freeCodeCamp ProjectReferenceData repository, showing each rider’s year and race time in seconds. The D3.js v6 code loads the dataset with `d3.json`, maps years and times using `scaleTime` and `scaleLinear`, and renders circles with `selectAll` and `join`. Axes are generated via `axisLeft` and `axisBottom` on an SVG canvas that fills the window. Each dot carries `data-xvalue` and `data-yvalue` attributes for potential interactivity, though no tooltip or hover behavior is implemented.
AI-generated descriptionA vanilla HTML implementation of a D3 scatter plot. Shows the Iris Dataset.
MIT Licensed




Comments
Sign in to join the discussion.