🌍 Public
Stylized Bar Chart
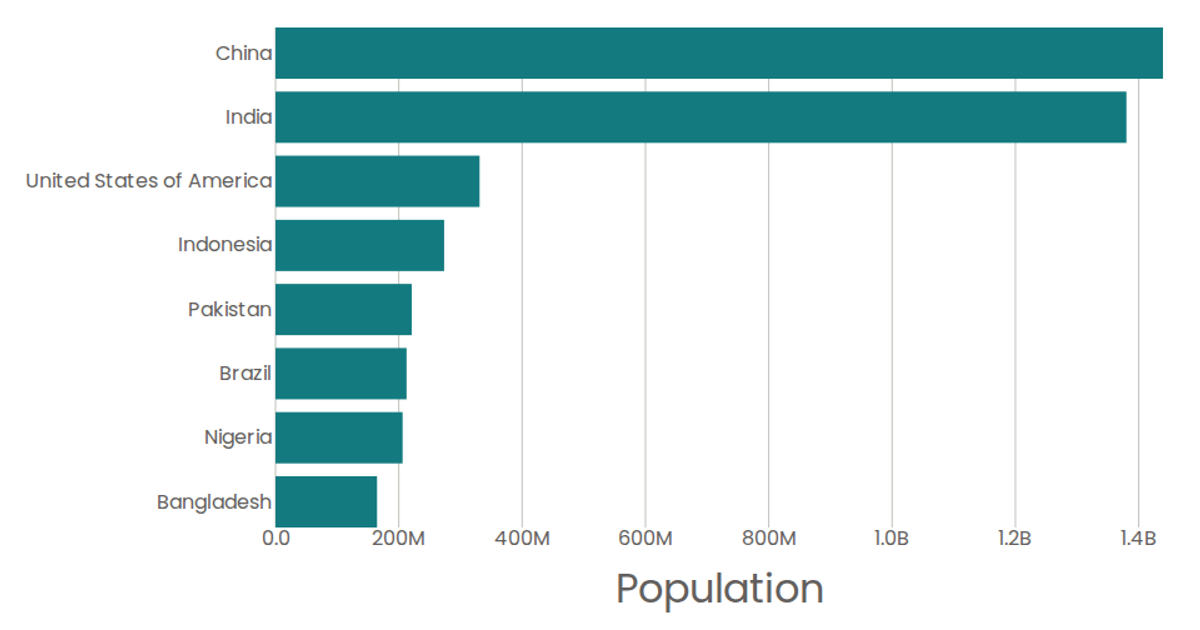
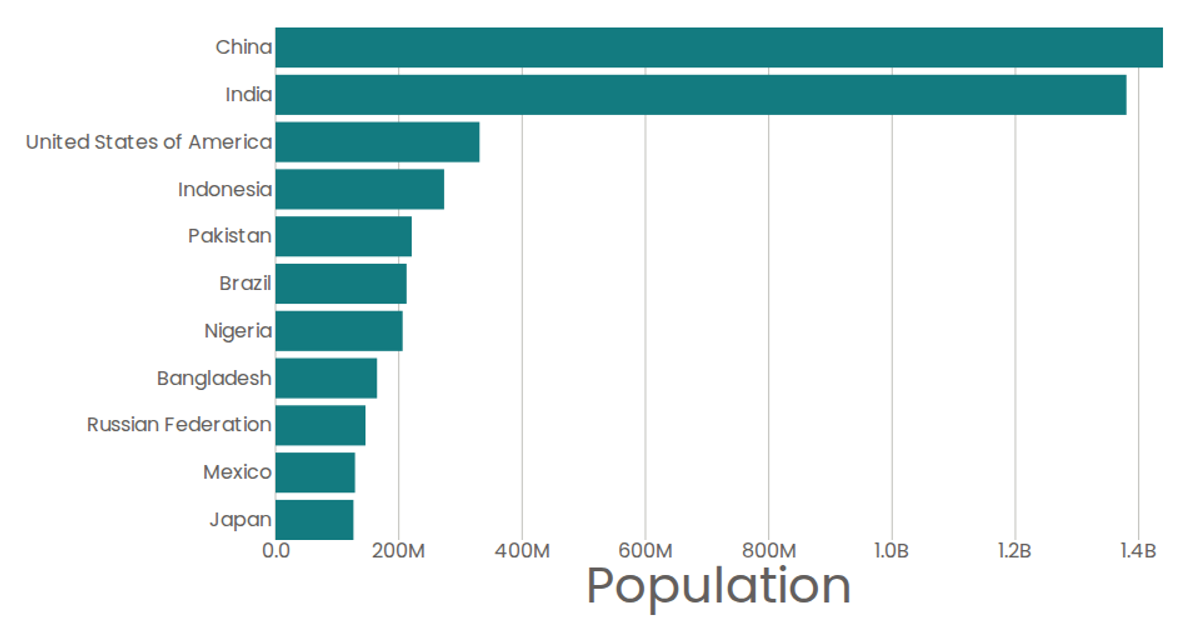
A stylized horizontal bar chart displays per-capita liters of pure alcohol consumption by country, with values shown via colored bars and a formatted x-axis. Built with React and D3 v5, it loads CSV data from a GitHub gist, uses d3.scaleBand and d3.scaleLinear for positioning, and renders SVG marks. d3.format abbreviates large numbers.
AI-generated descriptionMIT Licensed




Comments
Sign in to join the discussion.