🌍 Public
Activity6Task-3-1
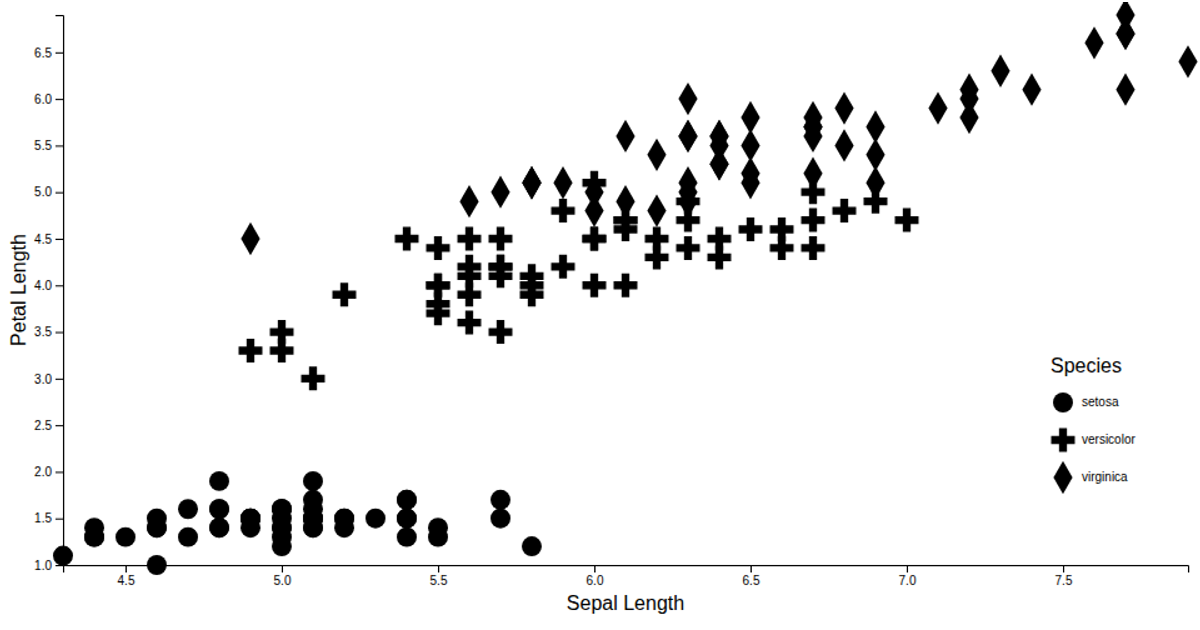
This interactive D3 scatter plot visualizes the Iris dataset, plotting sepal length against petal length for individual flowers. The chart uses different symbol shapes (from `d3.symbol` and `symbolsFill`) to distinguish between the three iris species, with a custom shape legend displaying the species labels. Axes are generated using `d3.axisLeft` and `d3.axisBottom` within a helper module. The data is loaded as CSV and parsed with `d3.csvParse` from the provided GitHub source, with numeric fields converted to numbers before rendering.
AI-generated descriptionMIT Licensed





Comments
Sign in to join the discussion.