🌍 Public
Ai_Graph
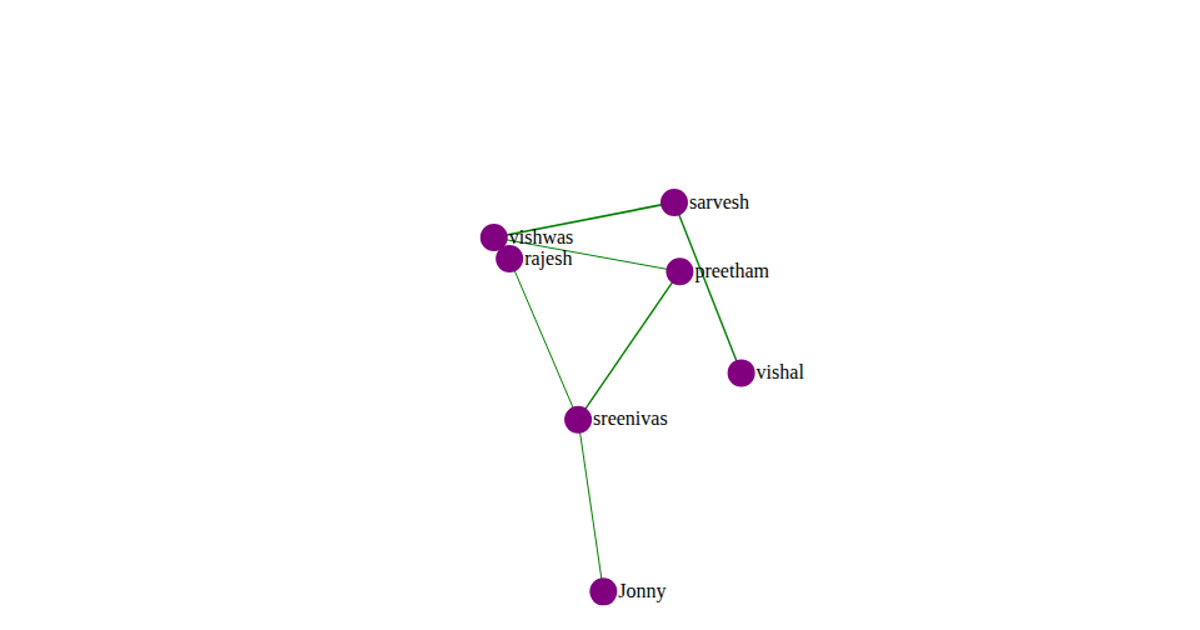
This example visualizes a small social network with six named nodes connected by weighted links, rendered as an SVG force-directed graph. The node labels are displayed next to yellow circles with red borders, and link thickness reflects the weight value from the JSON data. The visualization uses d3.layout.force to simulate the physics, with a gravity of 0.05, a link distance of 150, and a charge of -100. Users can click and drag nodes to reposition them, with the tick handler updating line coordinates and node transforms in real time.
AI-generated descriptionSee also React Starter.
MIT Licensed




Comments
Sign in to join the discussion.