🌍 Public
Area_Chart_Ass-II
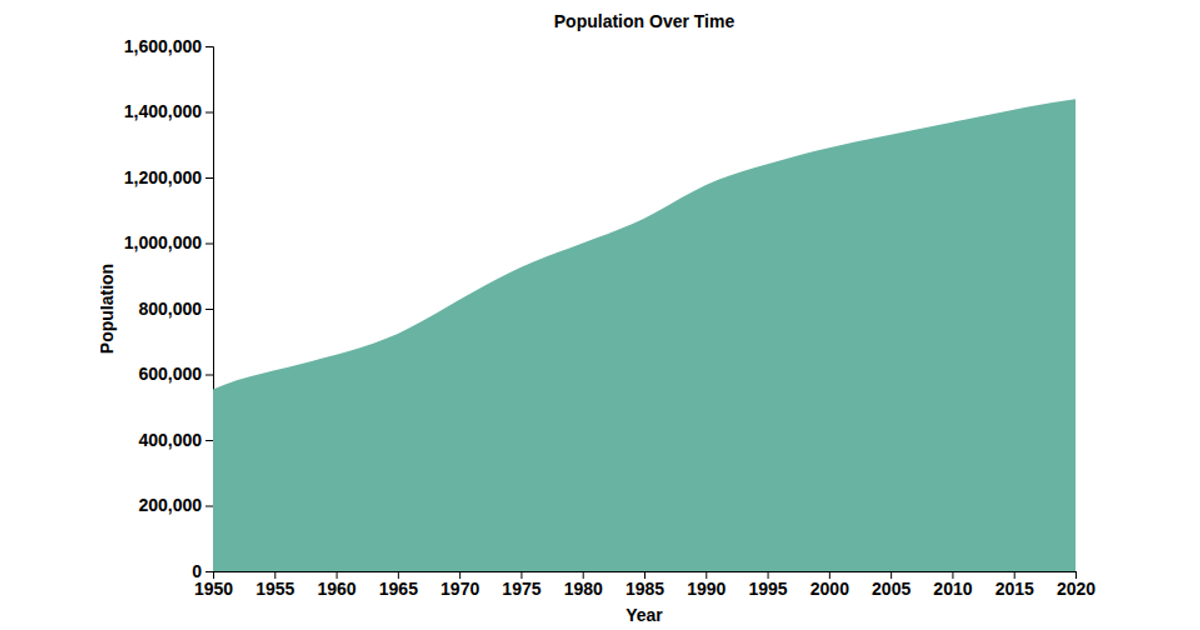
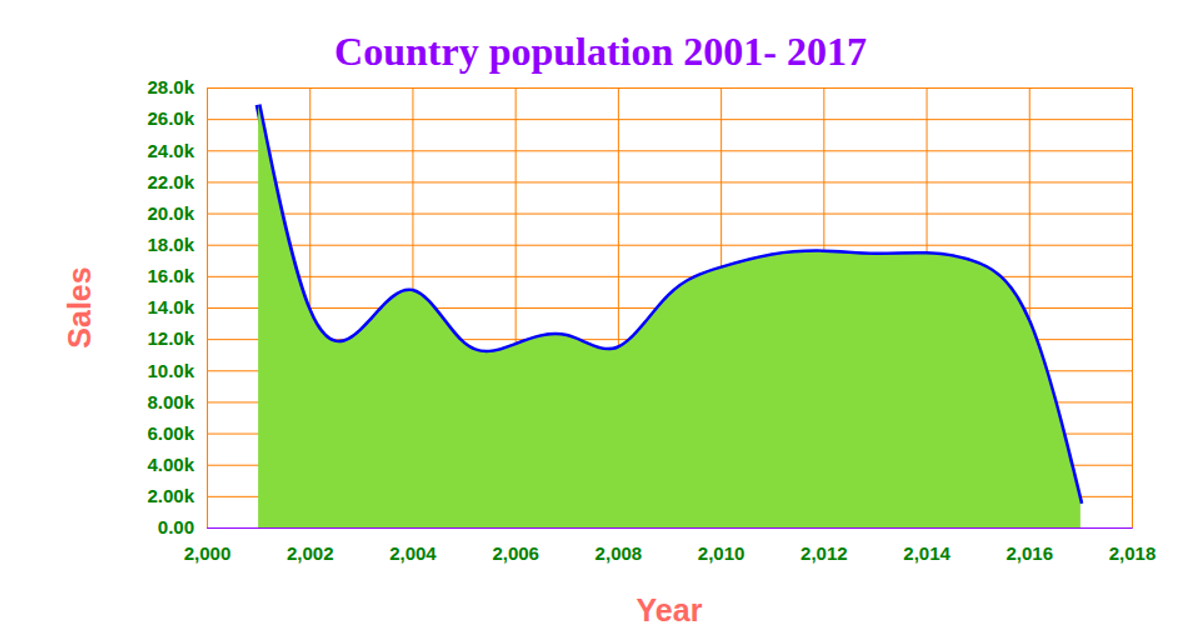
This area chart displays the number of convicts in Andhra Pradesh, India, from 2001 to 2012, based on data loaded from a GitHub-hosted CSV file. It uses D3 v5 with SVG rendering, employing `d3.scaleTime` and `d3.scaleLinear` for the axes, `d3.area` with a curve basis for the filled path, and `d3.axisBottom` and `d3.axisLeft` for labeled tick marks. The code also applies custom CSS classes for the title and axis labels, and formats the y-axis tick values using `d3.format`.
AI-generated descriptionAn example showing the capabilities of VizHub:
- Loads D3 via UNPKG.
- Demonstrates use of
importfrom"d3". - Demonstrates use of
importfrom local ES6 modules.
MIT Licensed


Comments
Sign in to join the discussion.