🌍 Public
Q1 module 8
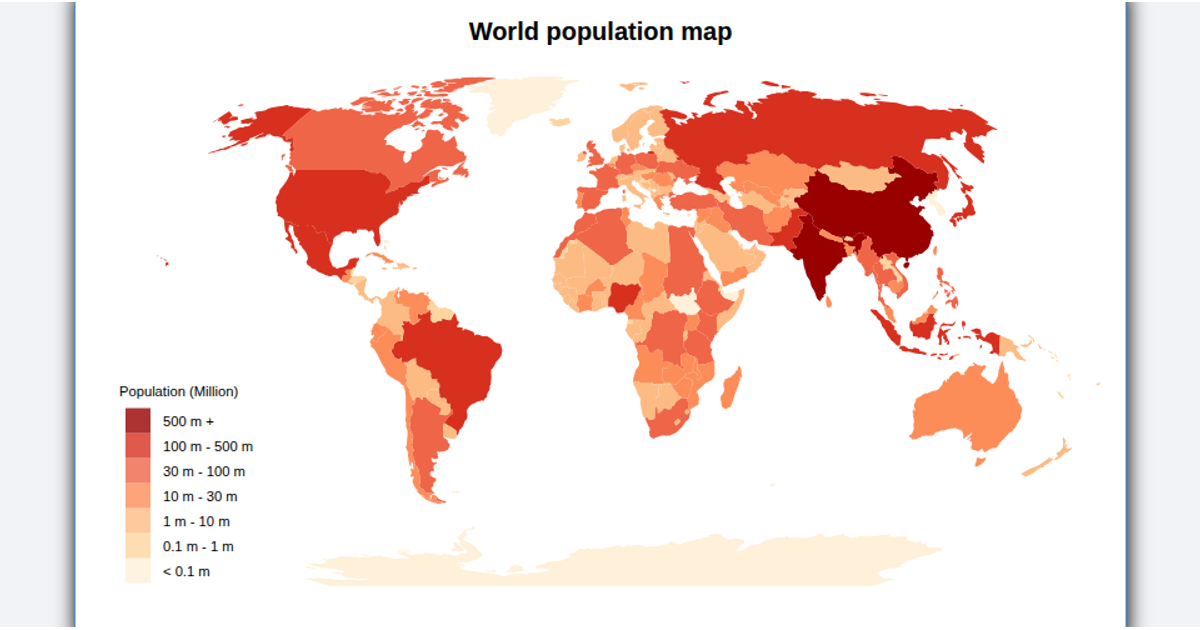
This example shows a simple choropleth world map of population for three countries: the United States, India, and China. A Mercator projection via `d3.geoMercator` and `d3.geoPath` renders the embedded GeoJSON polygons. Each country’s fill uses a sequential color scale with `d3.interpolateBlues` based on population values from an in-memory JavaScript object. Hovering reveals a tooltip with country name and population via SVG `<title>` elements.
AI-generated descriptionMIT Licensed


Comments
Sign in to join the discussion.