🌍 Public
Q2 Pie Chart
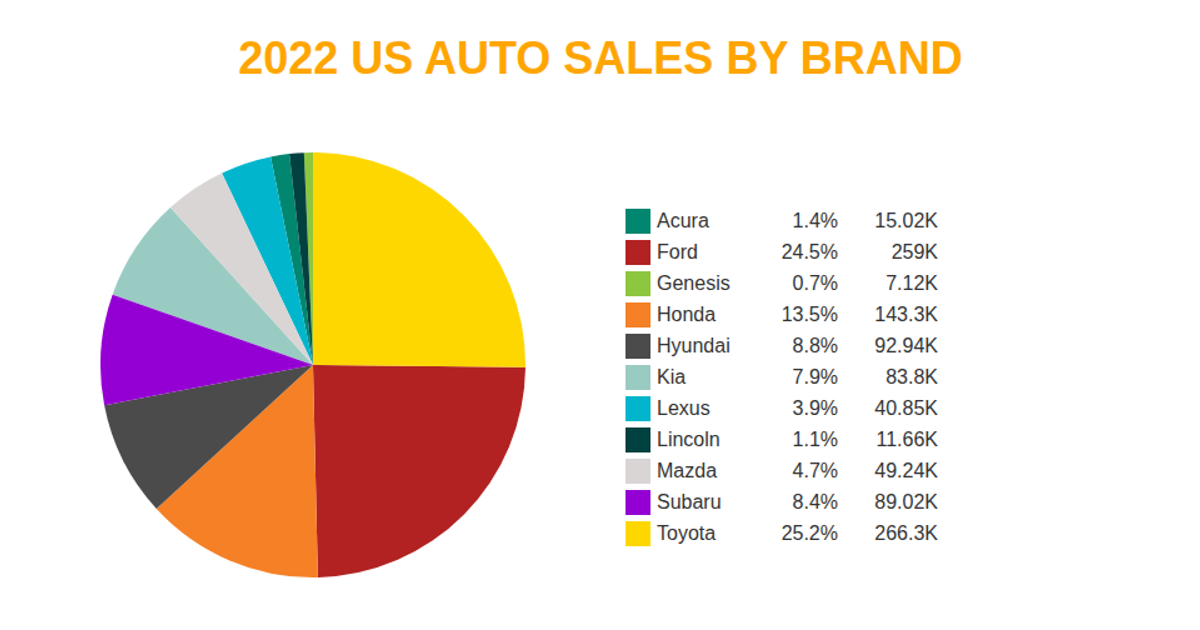
A pie chart visualizes 2022 US auto sales by brand, with each slice sized by year-to-date sales and labeled in the legend with percentage and sales volume in thousands. The chart encodes data using the `pie` and `arc` functions from D3 v5, with an ordinal color scale mapping brand values to distinct hues. Legends are rendered as SVG groups, showing brand names, percentage shares, and sales figures formatted with `format`. The data is loaded as CSV from a GitHub Gist via `d3.csv`, and the chart is drawn entirely in SVG within an HTML page.
AI-generated descriptionMIT Licensed


Comments
Sign in to join the discussion.