🌍 Public
Activity6_Task3
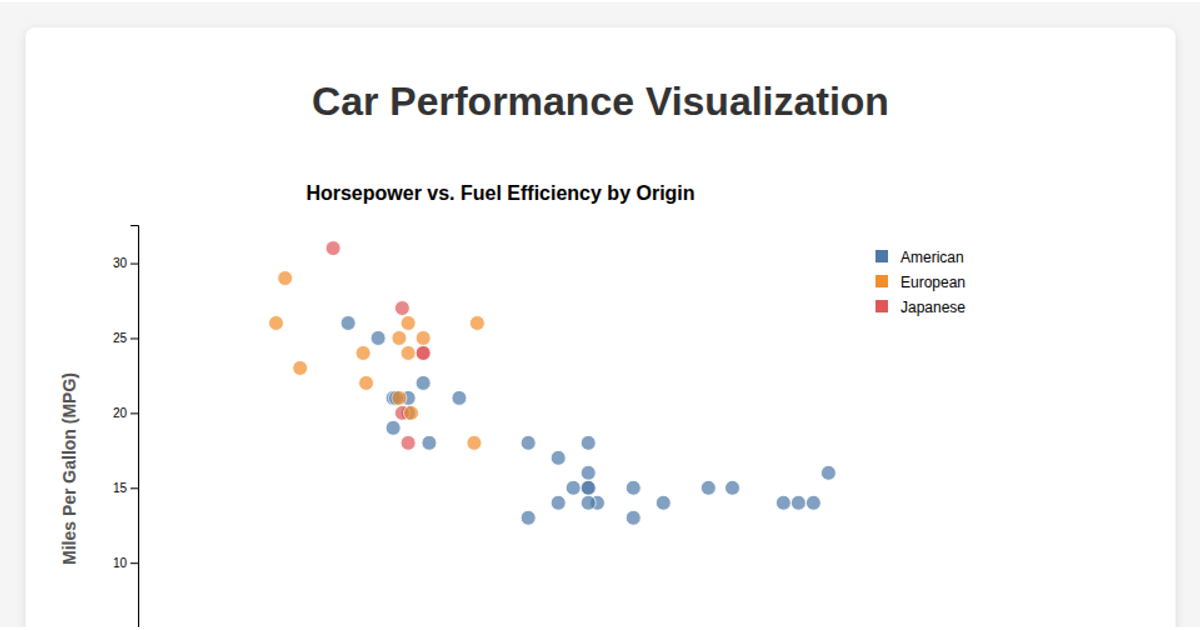
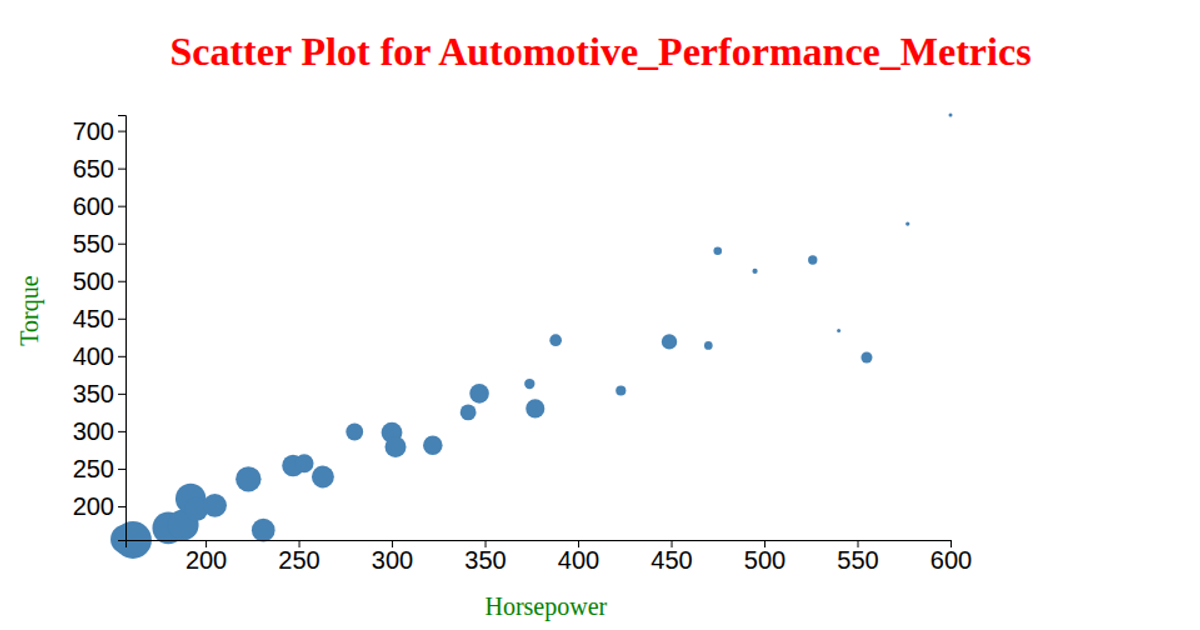
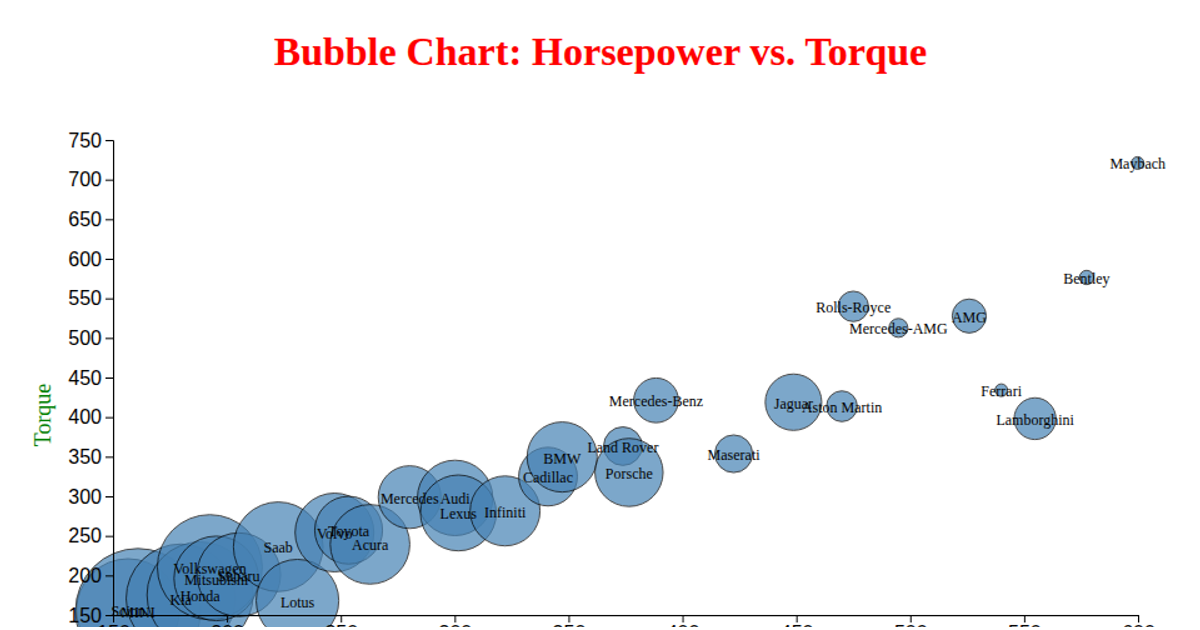
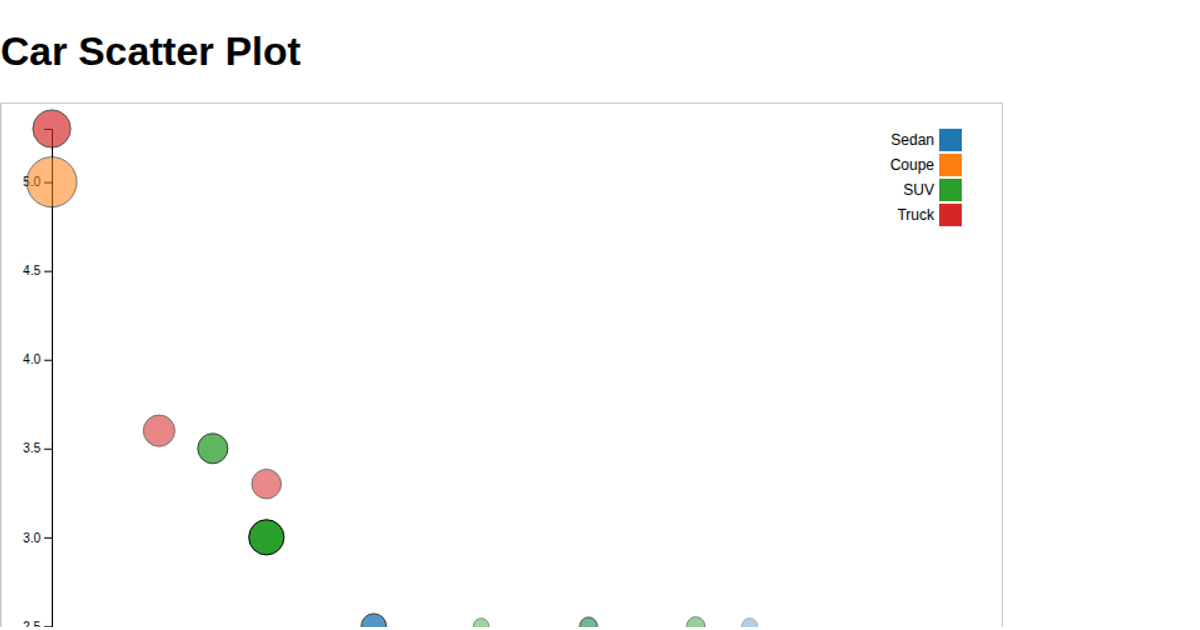
A scatter plot shows the relationship between EngineSize and FuelEfficiency for eight car models, revealing a generally negative correlation where larger engines consume more fuel. The visualization is rendered as an SVG using D3.js v7, with data loaded from a local CSV file. The script constructs circles positioned by mapping data values to x and y coordinates, and includes axis labels and tick marks styled through CSS. Dot borders are drawn with a dark stroke for clarity.
AI-generated descriptionMIT Licensed




Comments
Sign in to join the discussion.