🌍 Public
country, year, population, vaccinated, percent_vaccinated
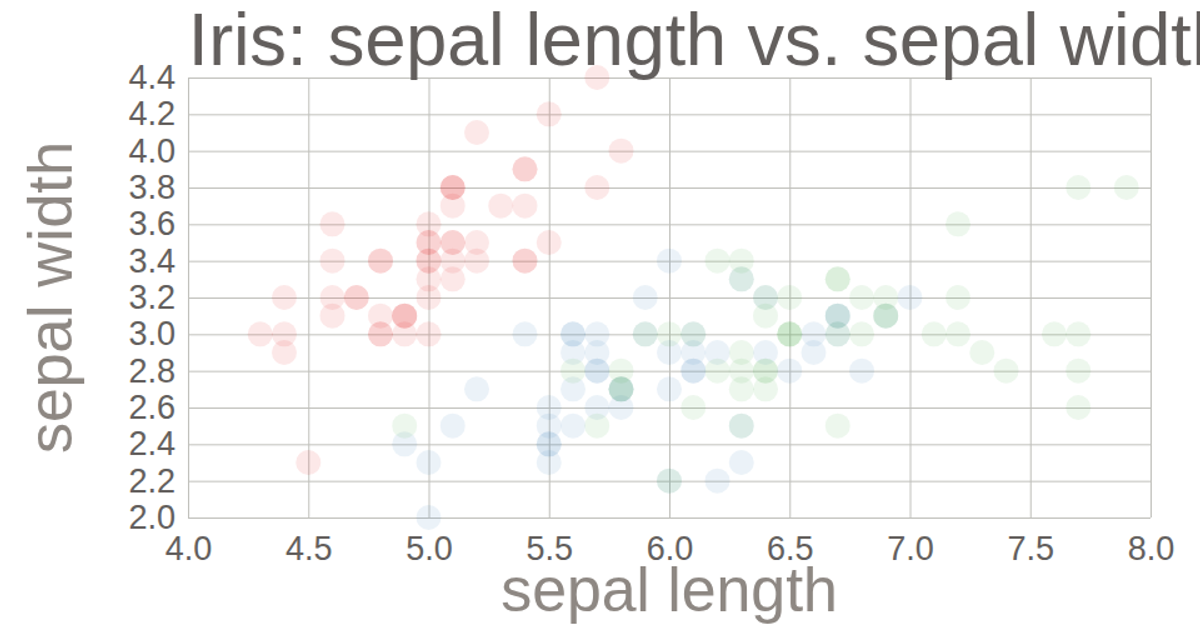
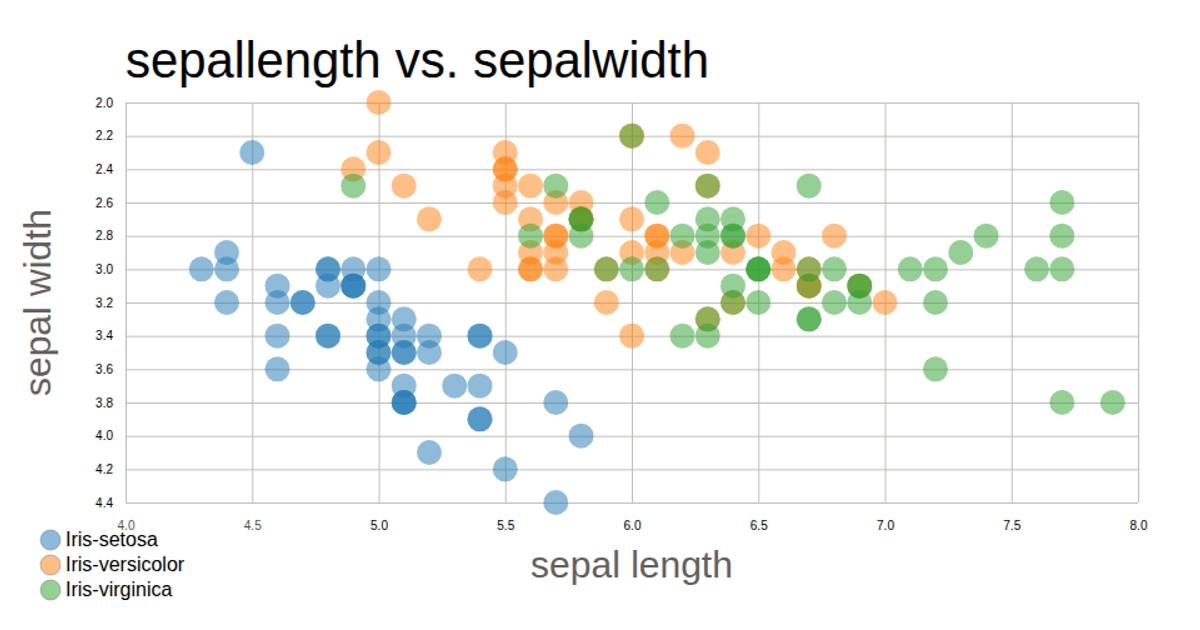
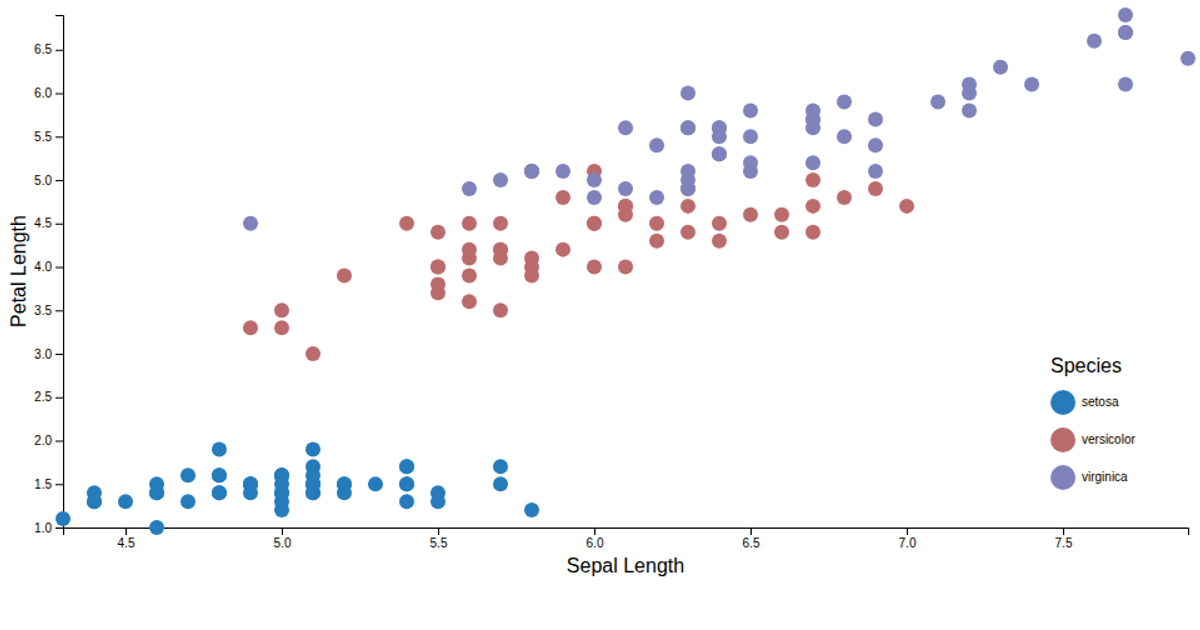
This scatterplot visualizes the Iris dataset, comparing sepal length and width across three species. The chart uses D3 scales and axes to position points, with a legend and color coding for species. Interactive hovering on legend items fades non-selected species, implemented with `setState` and opacity adjustments. The data is loaded via D3's `csv` function from a remote URL.
AI-generated descriptionMIT Licensed





Comments
Sign in to join the discussion.