🌍 Public
priyanka
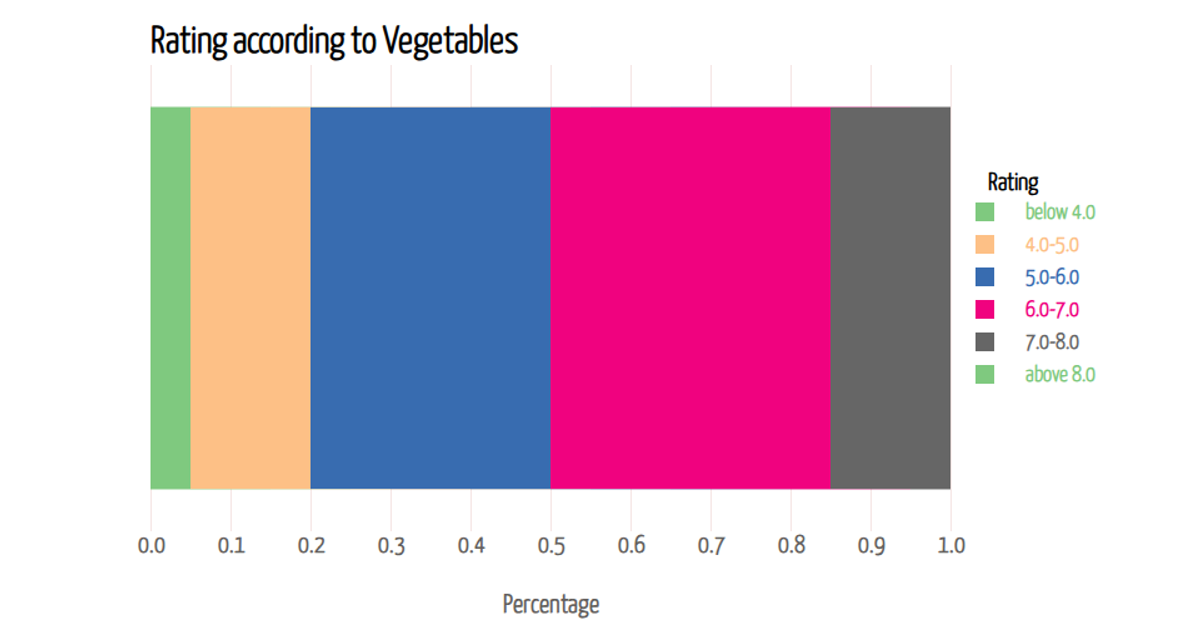
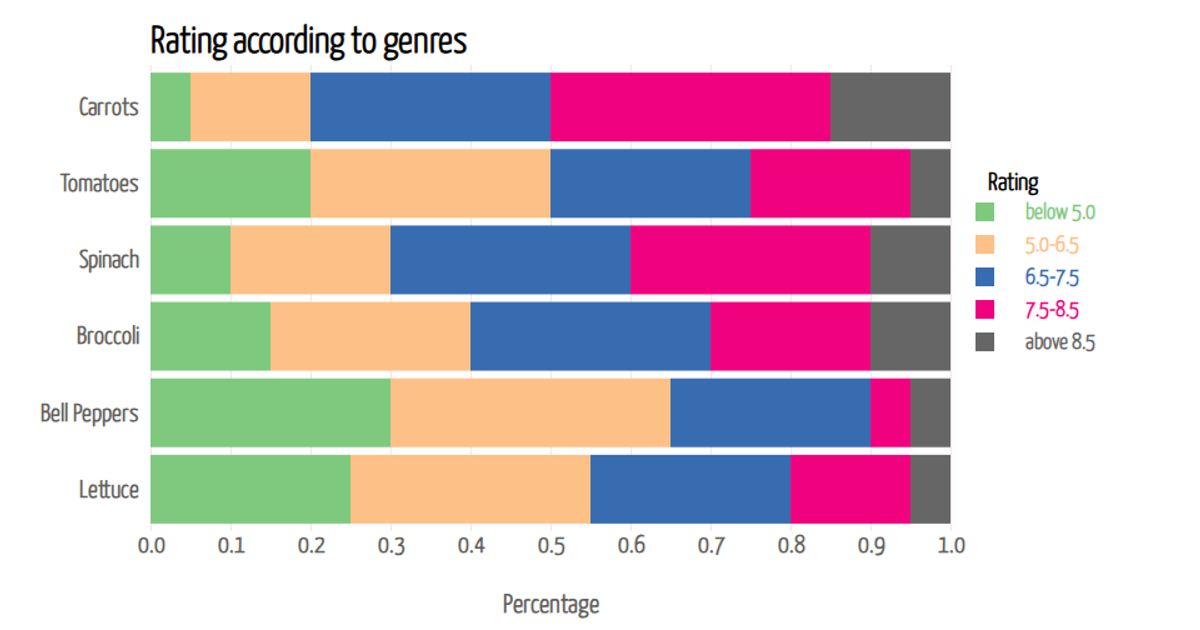
A stacked bar chart displays the percentage distribution of vegetable ratings across six categories, from "below 4.0" to "above 8.0," for vegetables like Carrots, Tomatoes, and Spinach. The chart loads data from a CSV file and renders as SVG using D3 v7. It uses d3.stack to compute stacked series, d3.scaleOrdinal for color encoding, and d3.scaleBand for the categorical y-axis. Interactive tooltips, implemented via mouse events, show precise percentages on hover, while d3.format displays values with two decimal places.
AI-generated descriptionAn example showing the capabilities of VizHub:
- Loads D3 via UNPKG.
- Demonstrates use of
importfrom"d3". - Demonstrates use of
importfrom local ES6 modules.
MIT Licensed





Comments
Sign in to join the discussion.