🌍 Public
Outlier Visualization 2E 2
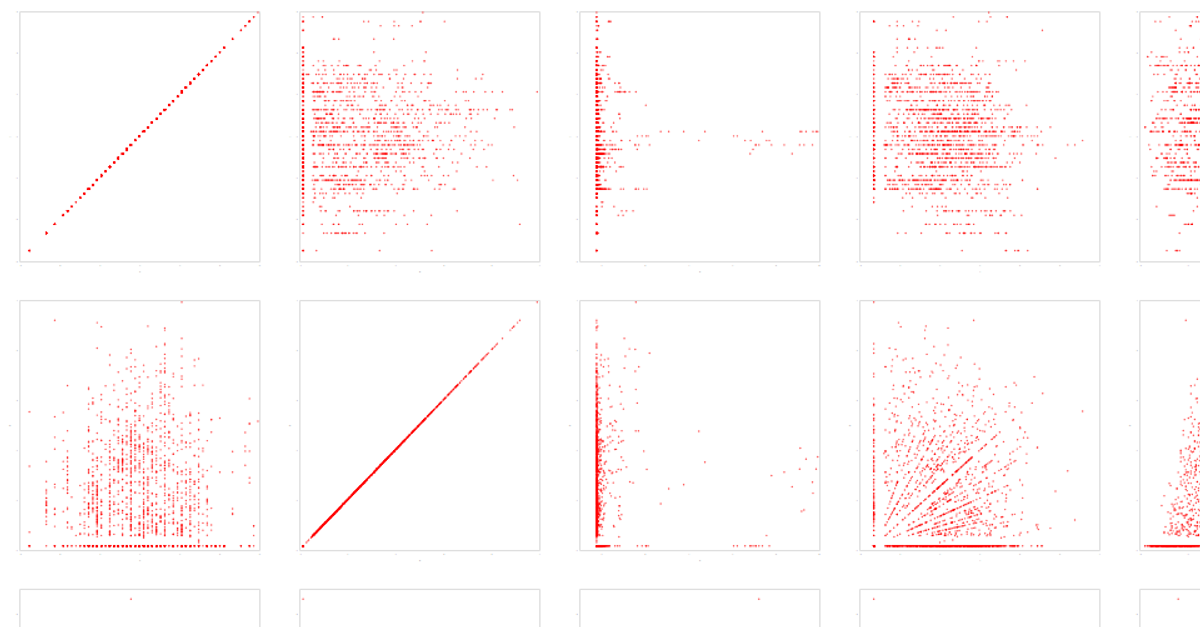
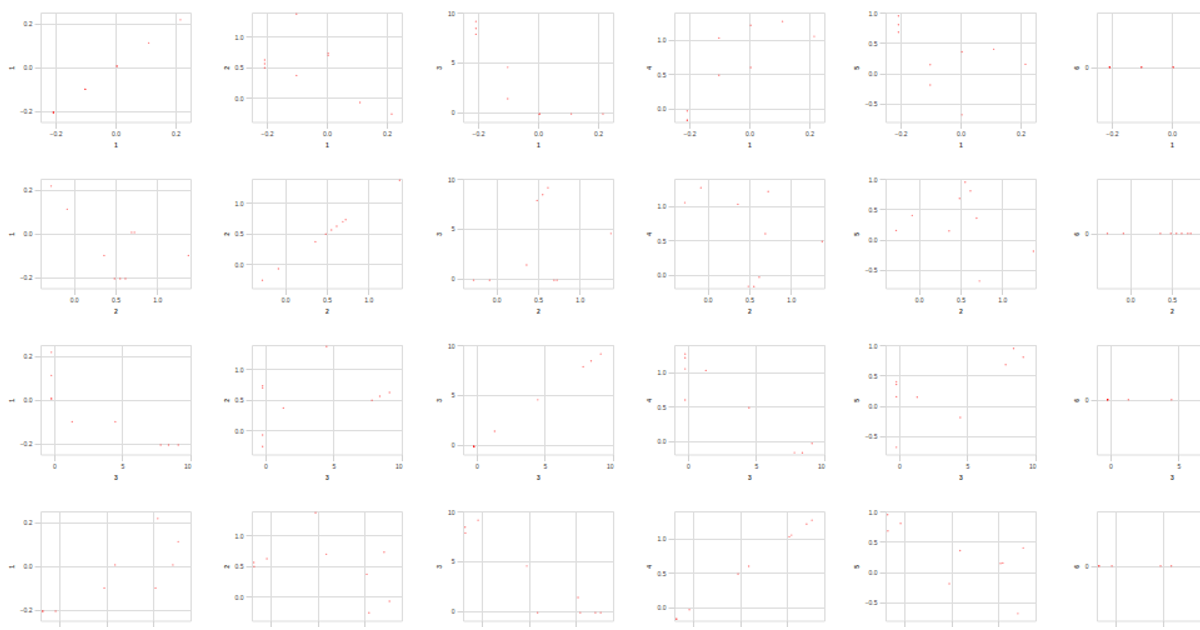
This visualization uses the Auto MPG dataset to explore outliers across 20 numeric attributes through a large scatter plot matrix, with each cell showing the relationship between two attributes. Users can brush to select a region, which highlights points identified as outliers in orange while dimming others to light gray. Built with Vega-Lite API and D3 v7, it repeats the same circle mark across rows and columns, applies a selection interval for brushing, and includes pan/zoom functionality via the panzoom library.
AI-generated descriptionA visualization constructed using the vega-lite-api.
The data shown here comes from the UCI Machine Learning Repository: Auto MPG Data Set, via Gist: Scatter Plot with Menus.
MIT Licensed





Comments
Sign in to join the discussion.