🌍 Public
(Hover) Line Chart Food Data
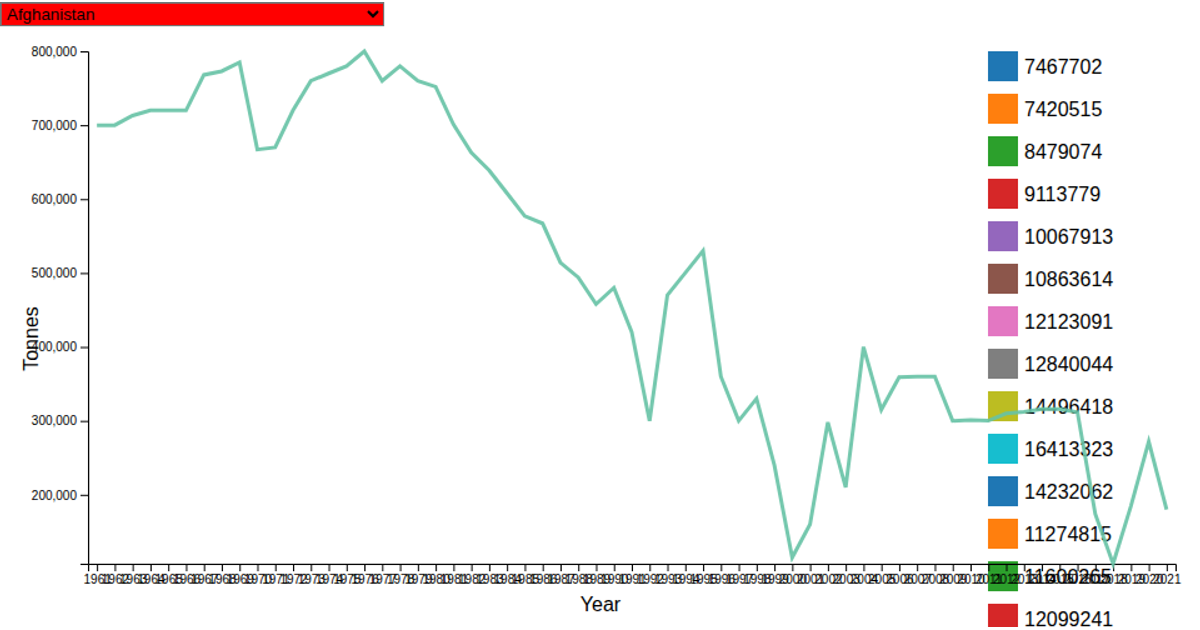
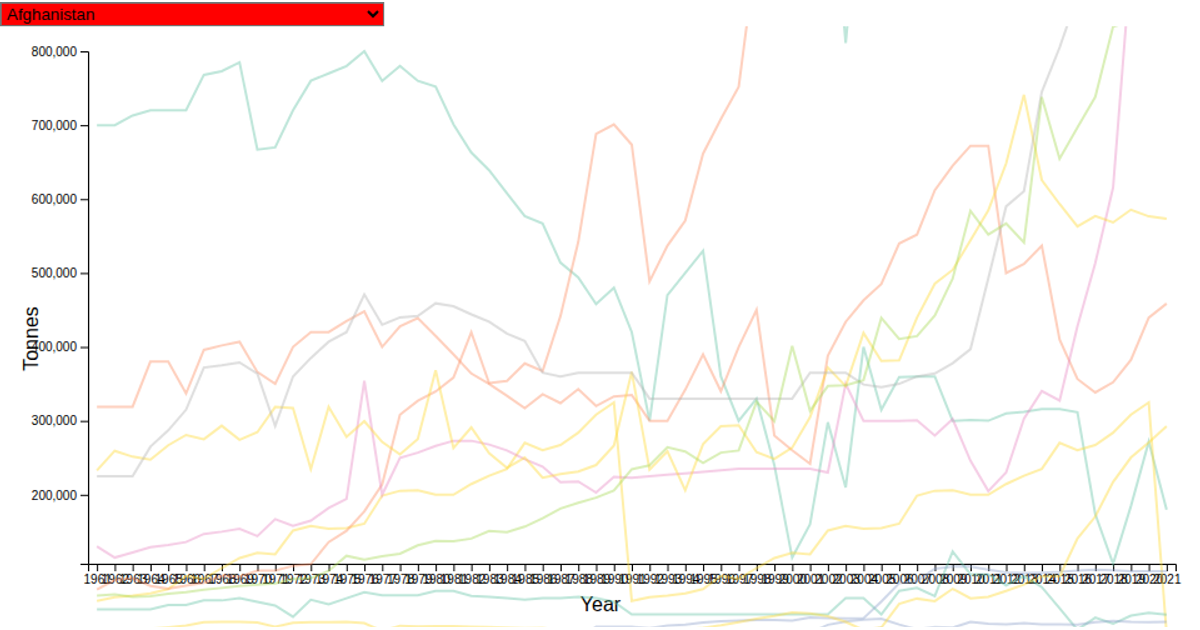
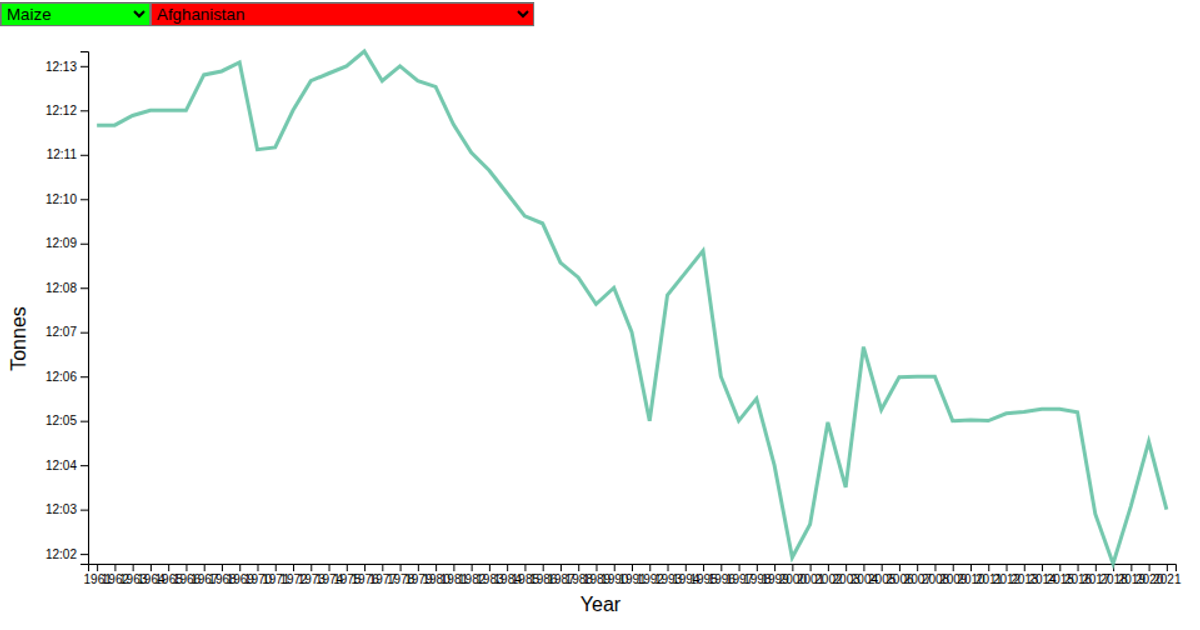
This interactive line chart visualizes coffee production in Bhutan over time, using World Food Production Data filtered to the country. It renders a single time-series line with a light gray plot area, while a mousemove event tracks the cursor position to draw crosshair lines within the chart’s bounds. The visualization uses D3’s scaleTime and scaleLinear for axes, d3-line for the path, and a ResizeObserver to adapt the SVG dimensions to its container.
AI-generated descriptionA simple line chart with D3 showing the World Food Production Data for Bhutan's coffee production.
MIT Licensed




Comments
Sign in to join the discussion.