🌍 Public
Untitled
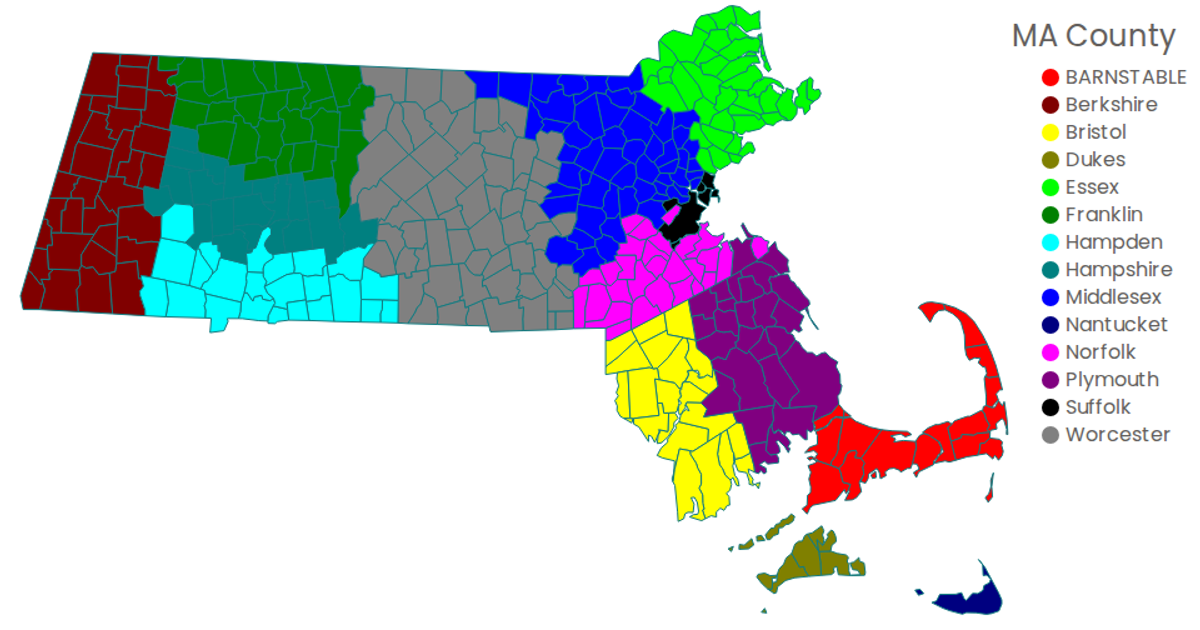
This visualization displays Massachusetts household income data by town, overlaid on an interactive Leaflet map. The map uses D3’s `geoPath` with a `geoTransform` to render census tract boundaries, with each town’s fill color mapped via `d3.scaleDiverging` based on the hhinc80k salary bracket. A separate canvas-based color ramp legend is generated using the Canvas API. The data is loaded from external GeoJSON and CSV files, with Leaflet providing the base tile layer and pan/zoom controls.
AI-generated descriptionMIT Licensed




Comments
Sign in to join the discussion.