🌍 Public
Interactive Color Legend
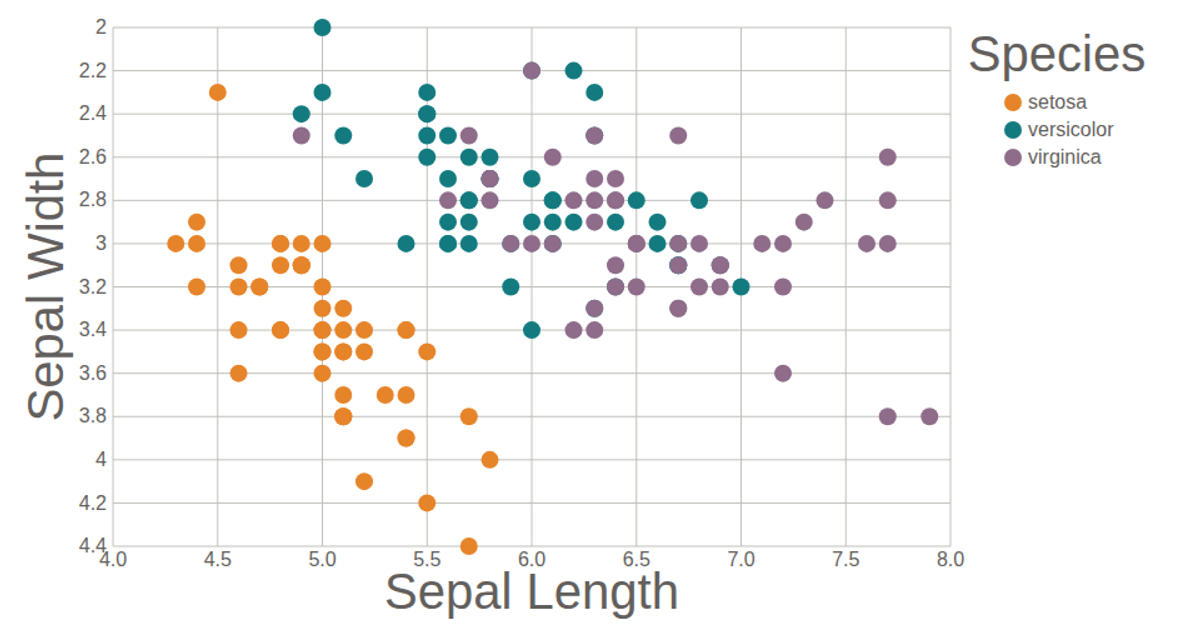
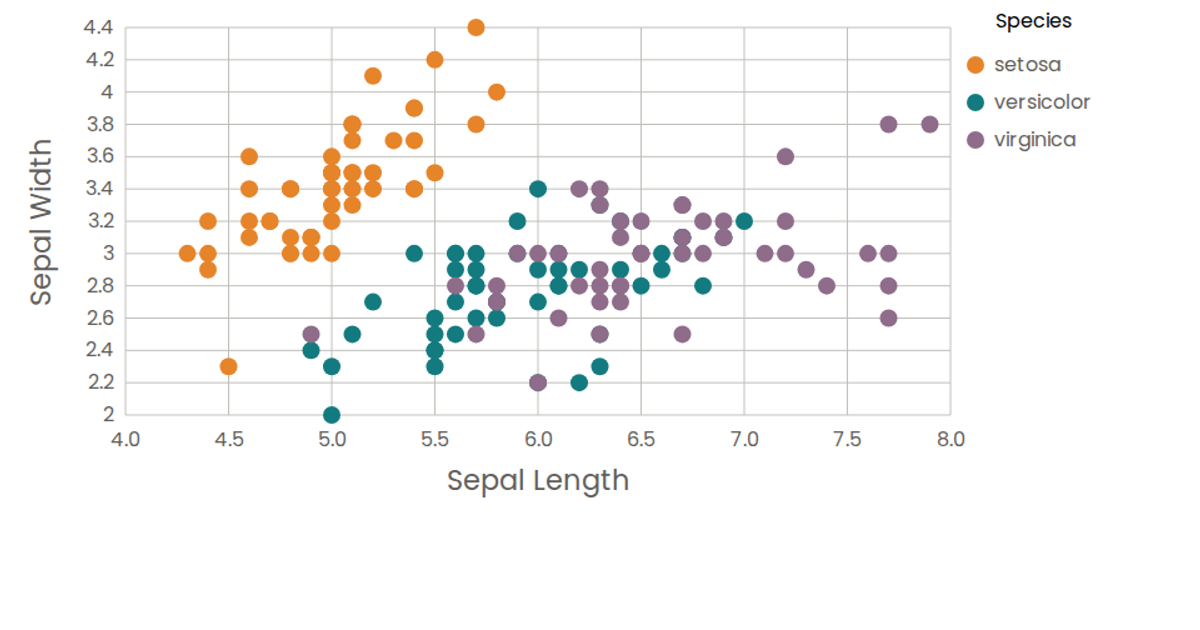
This interactive color legend displays the Iris dataset's sepal length and width, using color to encode species. Hovering over a legend item fades all other data points while highlighting the selected species, making it easy to compare groups. Built with React and D3 v6, the visualization renders circles as an SVG and uses `scaleOrdinal` for color mapping and `scaleLinear` for axes. The legend's `onMouseEnter` and `onMouseOut` events drive the interactive filtering, while the chart's circles respond to the hover state.
AI-generated descriptionUnited Nation Population Bar Chart
MIT Licensed




Comments
Sign in to join the discussion.