🌍 Public
heatmap_cities
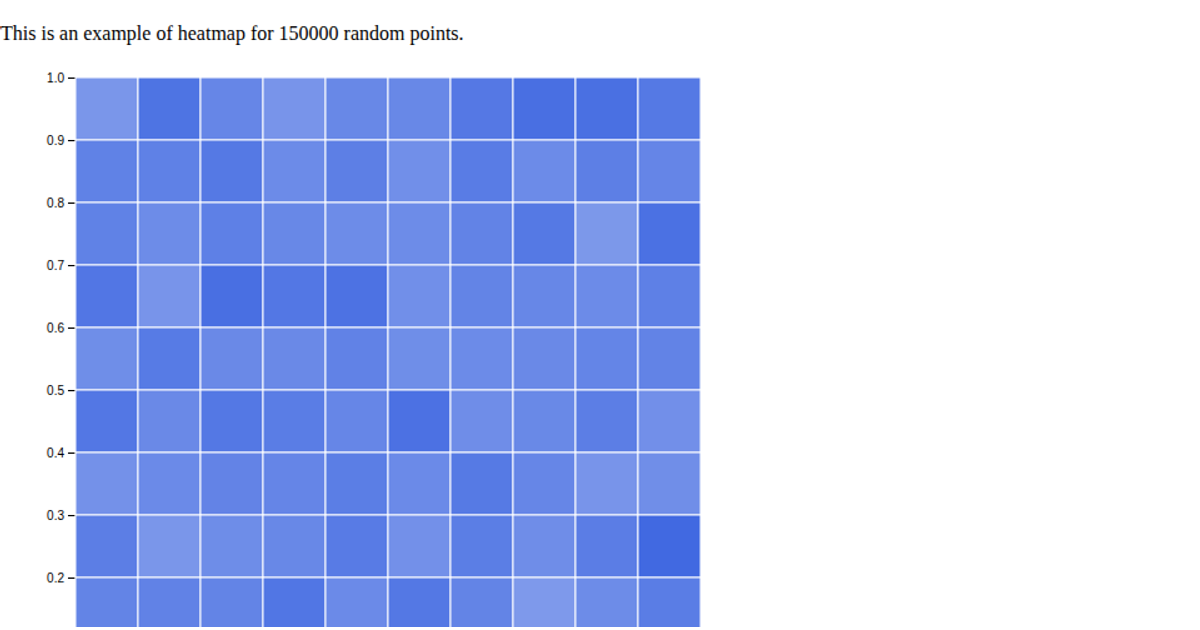
This example visualizes screen dimensions by rendering the current browser width and height as a large, heatmap-like typographic display. It shows a minimal grid of numeric cell blocks that update based on window size, with the current viewport measurements logged to the console. The code uses D3 v7’s `select` and `range` functions to manage the DOM and generate table structures, while dynamically reading `window.innerWidth` and `window.innerHeight` to populate the layout. The rendering approach relies on raw JavaScript and D3’s data-binding to build the visualization in a blank HTML body.
AI-generated descriptionA demonstration of how to start using D3 version 6.
MIT Licensed





Comments
Sign in to join the discussion.